Monitor your surface
By the end of this page, you will have seen the test requests from the previous guides appear in three places, confirming that traffic is routing, cost is being metered, and guardrail rejections are being recorded.
The test requests you already sent provide the traffic used in this page. No new surface configuration is required.
Prerequisites
- Completed Add guardrails and a budget.
- You have sent at least one request using the test commands from the previous guides.
Steps
See request traffic in the Monitoring tab
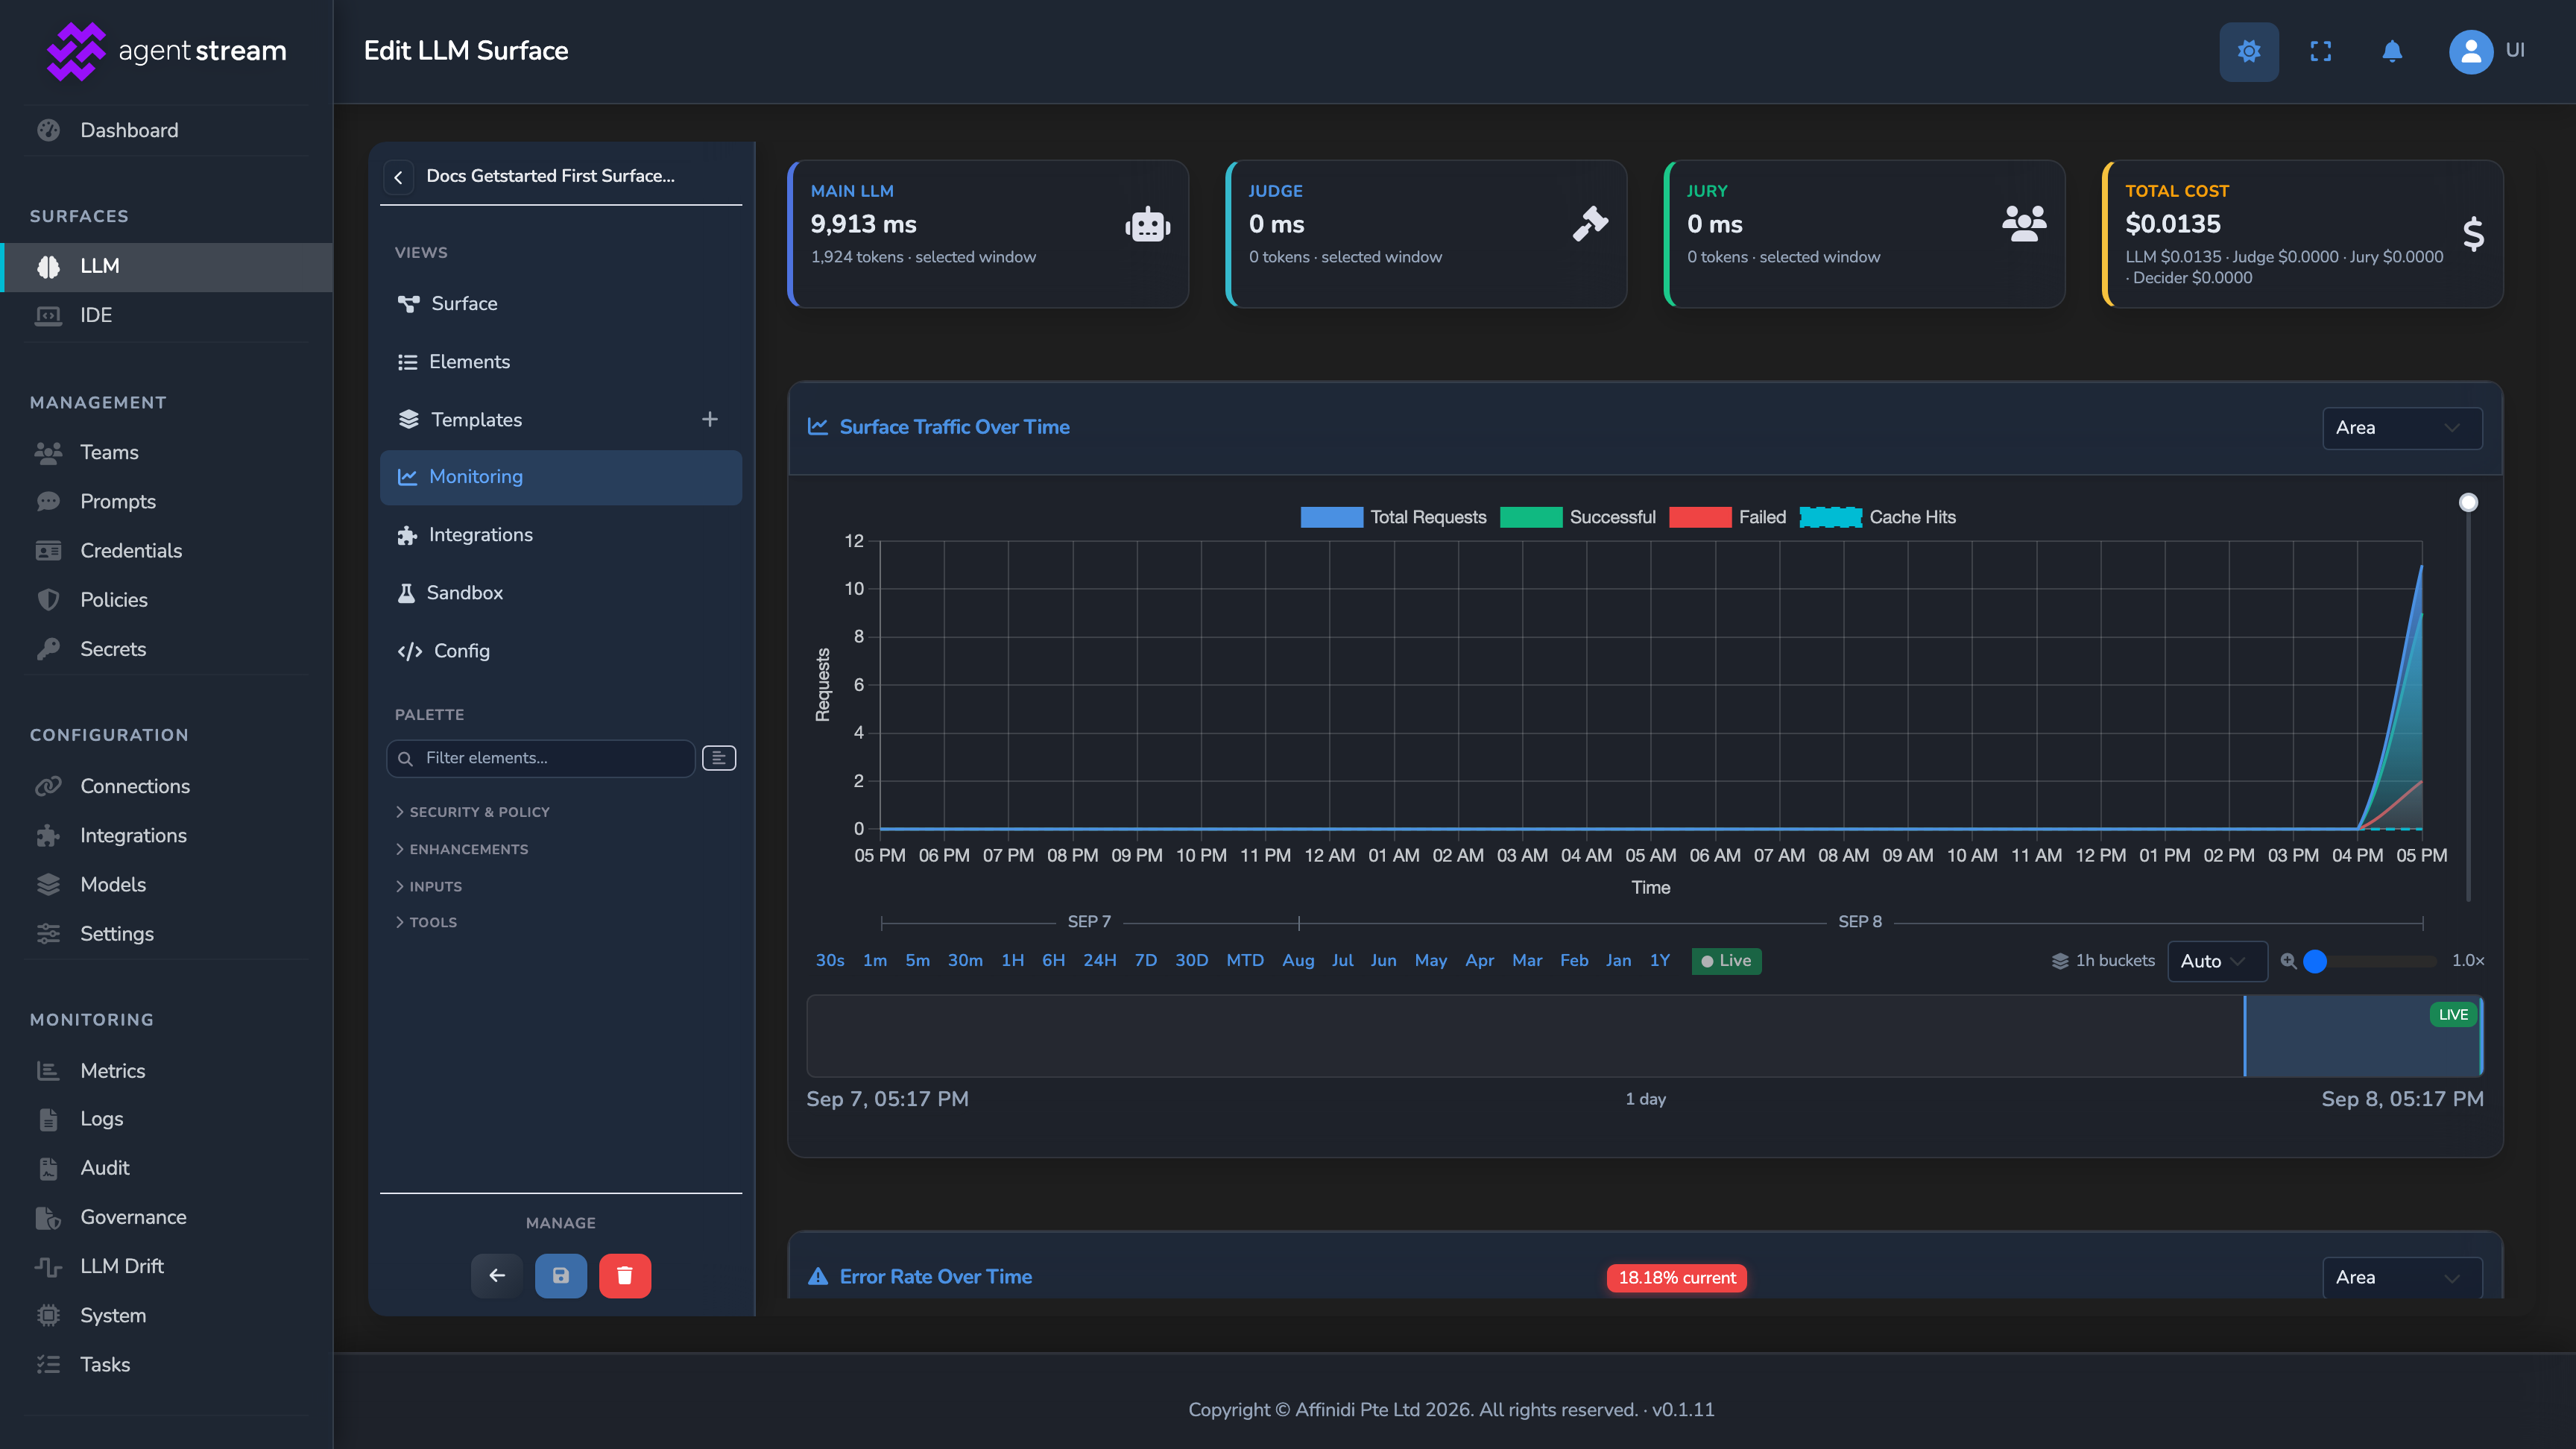
Each surface has its own Monitoring tab, scoped to that surface alone, with several more charts below the one shown here.
Under SURFACES in the sidebar, select LLM, then open the surface you created in Create your first LLM Surface. Select the Monitoring tab.
Look for the following, updated in near real time:
- Summary cards: Main LLM, Judge, and Jury latency and token figures, plus total cost, for the selected window.
- Surface Traffic Over Time and Error Rate Over Time: request volume and the share of requests that failed.
- Connection Latency Over Time: response time at p50, p95, and p99.
- Token Usage Over Time: input and output token consumption for every request this surface handled, including the test calls from the previous guides.
Because metering runs per stage, a Judge or Jury on this surface shows its own latency and tokens in its own summary card, and its own share of the Total Cost breakdown, rather than being folded into one figure for the whole request. See Cost and usage governance →.
Read cost and usage from the response headers
Send any test request again, this time with curl -i to see the response headers:
curl -k -i -X POST "https://<YOUR_APPLIANCE_HOST><YOUR_SURFACE_ROUTE>/v1/chat/completions" \
  -H "Content-Type: application/json" \
  -d '{
    "messages": [
      { "role": "user", "content": "One more test request." }
    ]
}'The -k flag disables TLS certificate verification. Use this for local testing only; remove it in production.
A buffered response carries x-agent-stream-* headers: trace ID, provider, model, token counts, cached-token count, cost, cache hit or miss, and the ingress wire format the caller used. A client can read cost and usage figures directly from these headers without parsing the response body. A streamed response carries the request-time subset of the same headers. See Observability → for the full signal list.
The trace ID in x-agent-stream-trace-id is the fastest way to correlate one specific curl call with its entry in the Monitoring tab or in an exported trace, if this appliance has OpenTelemetry export configured.
Check the rejection breakdown

Still on the Monitoring tab, find the Rejections by category card. Every guardrail block that rejects a request is classified into a rejection category, with Uncategorized as the fallback, and counted here. A guardrail that only redacts a value or replaces it with a NER ID doesn’t reject the request, so it isn’t counted.
The redacted email request from Add guardrails and a budget does not appear here at all: redaction is not a rejection. If you send a request that Prompt Guard rejects, it appears in this breakdown. A usage-limit 429 is not a content rejection, so this card leaves it out.
Confirm
Confirm the following three views all show data from your test traffic:
- The Monitoring tab’s summary cards and traffic chart show non-zero spend.
- The
curl -iresponse in step 2 includes anx-agent-stream-cost-usdheader. - Sending a request Prompt Guard actually rejects produces an entry in the rejection breakdown.
Other monitoring tools
Beyond the per-surface Monitoring tab, the appliance also offers:
- The dashboard overview page, showing cost, tokens, latency, throughput, and cache savings across the appliance, with charts for the surfaces with the most spend and traffic.
- Exports to tools your team already runs: traces, metrics, and audit logs over OpenTelemetry (OTLP), metrics from a Prometheus scrape endpoint, and events through webhook integrations. See Observability →.
- Governance records, a signed, tamper-evident transcript of what entered and left a surface, if recording is enabled. See Governance records →.
- LLM Drift, under Monitoring in the sidebar, which compares a surface’s behaviour with a pinned baseline once its Drift Harness is switched on. See LLM drift detection →.
Next steps
- Observability: The full telemetry model and how to export it to your own stack.
- Teams and attribution: Attribute this surface’s usage to individual members and teams.
- Governance records: The signed, tamper-evident transcript of what entered and left a surface.
- How-to guides: Configure routing, resilience, and additional guardrail layers on your surfaces.
Glad to hear it. Thanks for letting us know.
Sorry to hear that. Thanks for letting us know.