Observability
Agent Stream is the source of truth for AI usage in your organisation, with no external time-series database required to see it, and it still exports to the tools you already run. Trust-fabric integration →
What gets recorded
| Signal | What it shows |
|---|---|
| Usage telemetry | Multi-resolution spend, token, and request time-series, from 30-second to yearly buckets, per surface, stage, member, and team. |
| Operational metrics | Connection volume, error rate, data throughput, and latency percentiles, at p50, p95, and p99, for fleet health. |
| Rejection taxonomy | Every guardrail block classified into a stable set of categories, such as hate, toxicity, prompt injection, jailbreak, PII, secrets, and policy violation, with Uncategorized as the fallback, broken down per team, member, surface, and stage. |
What the dashboard shows
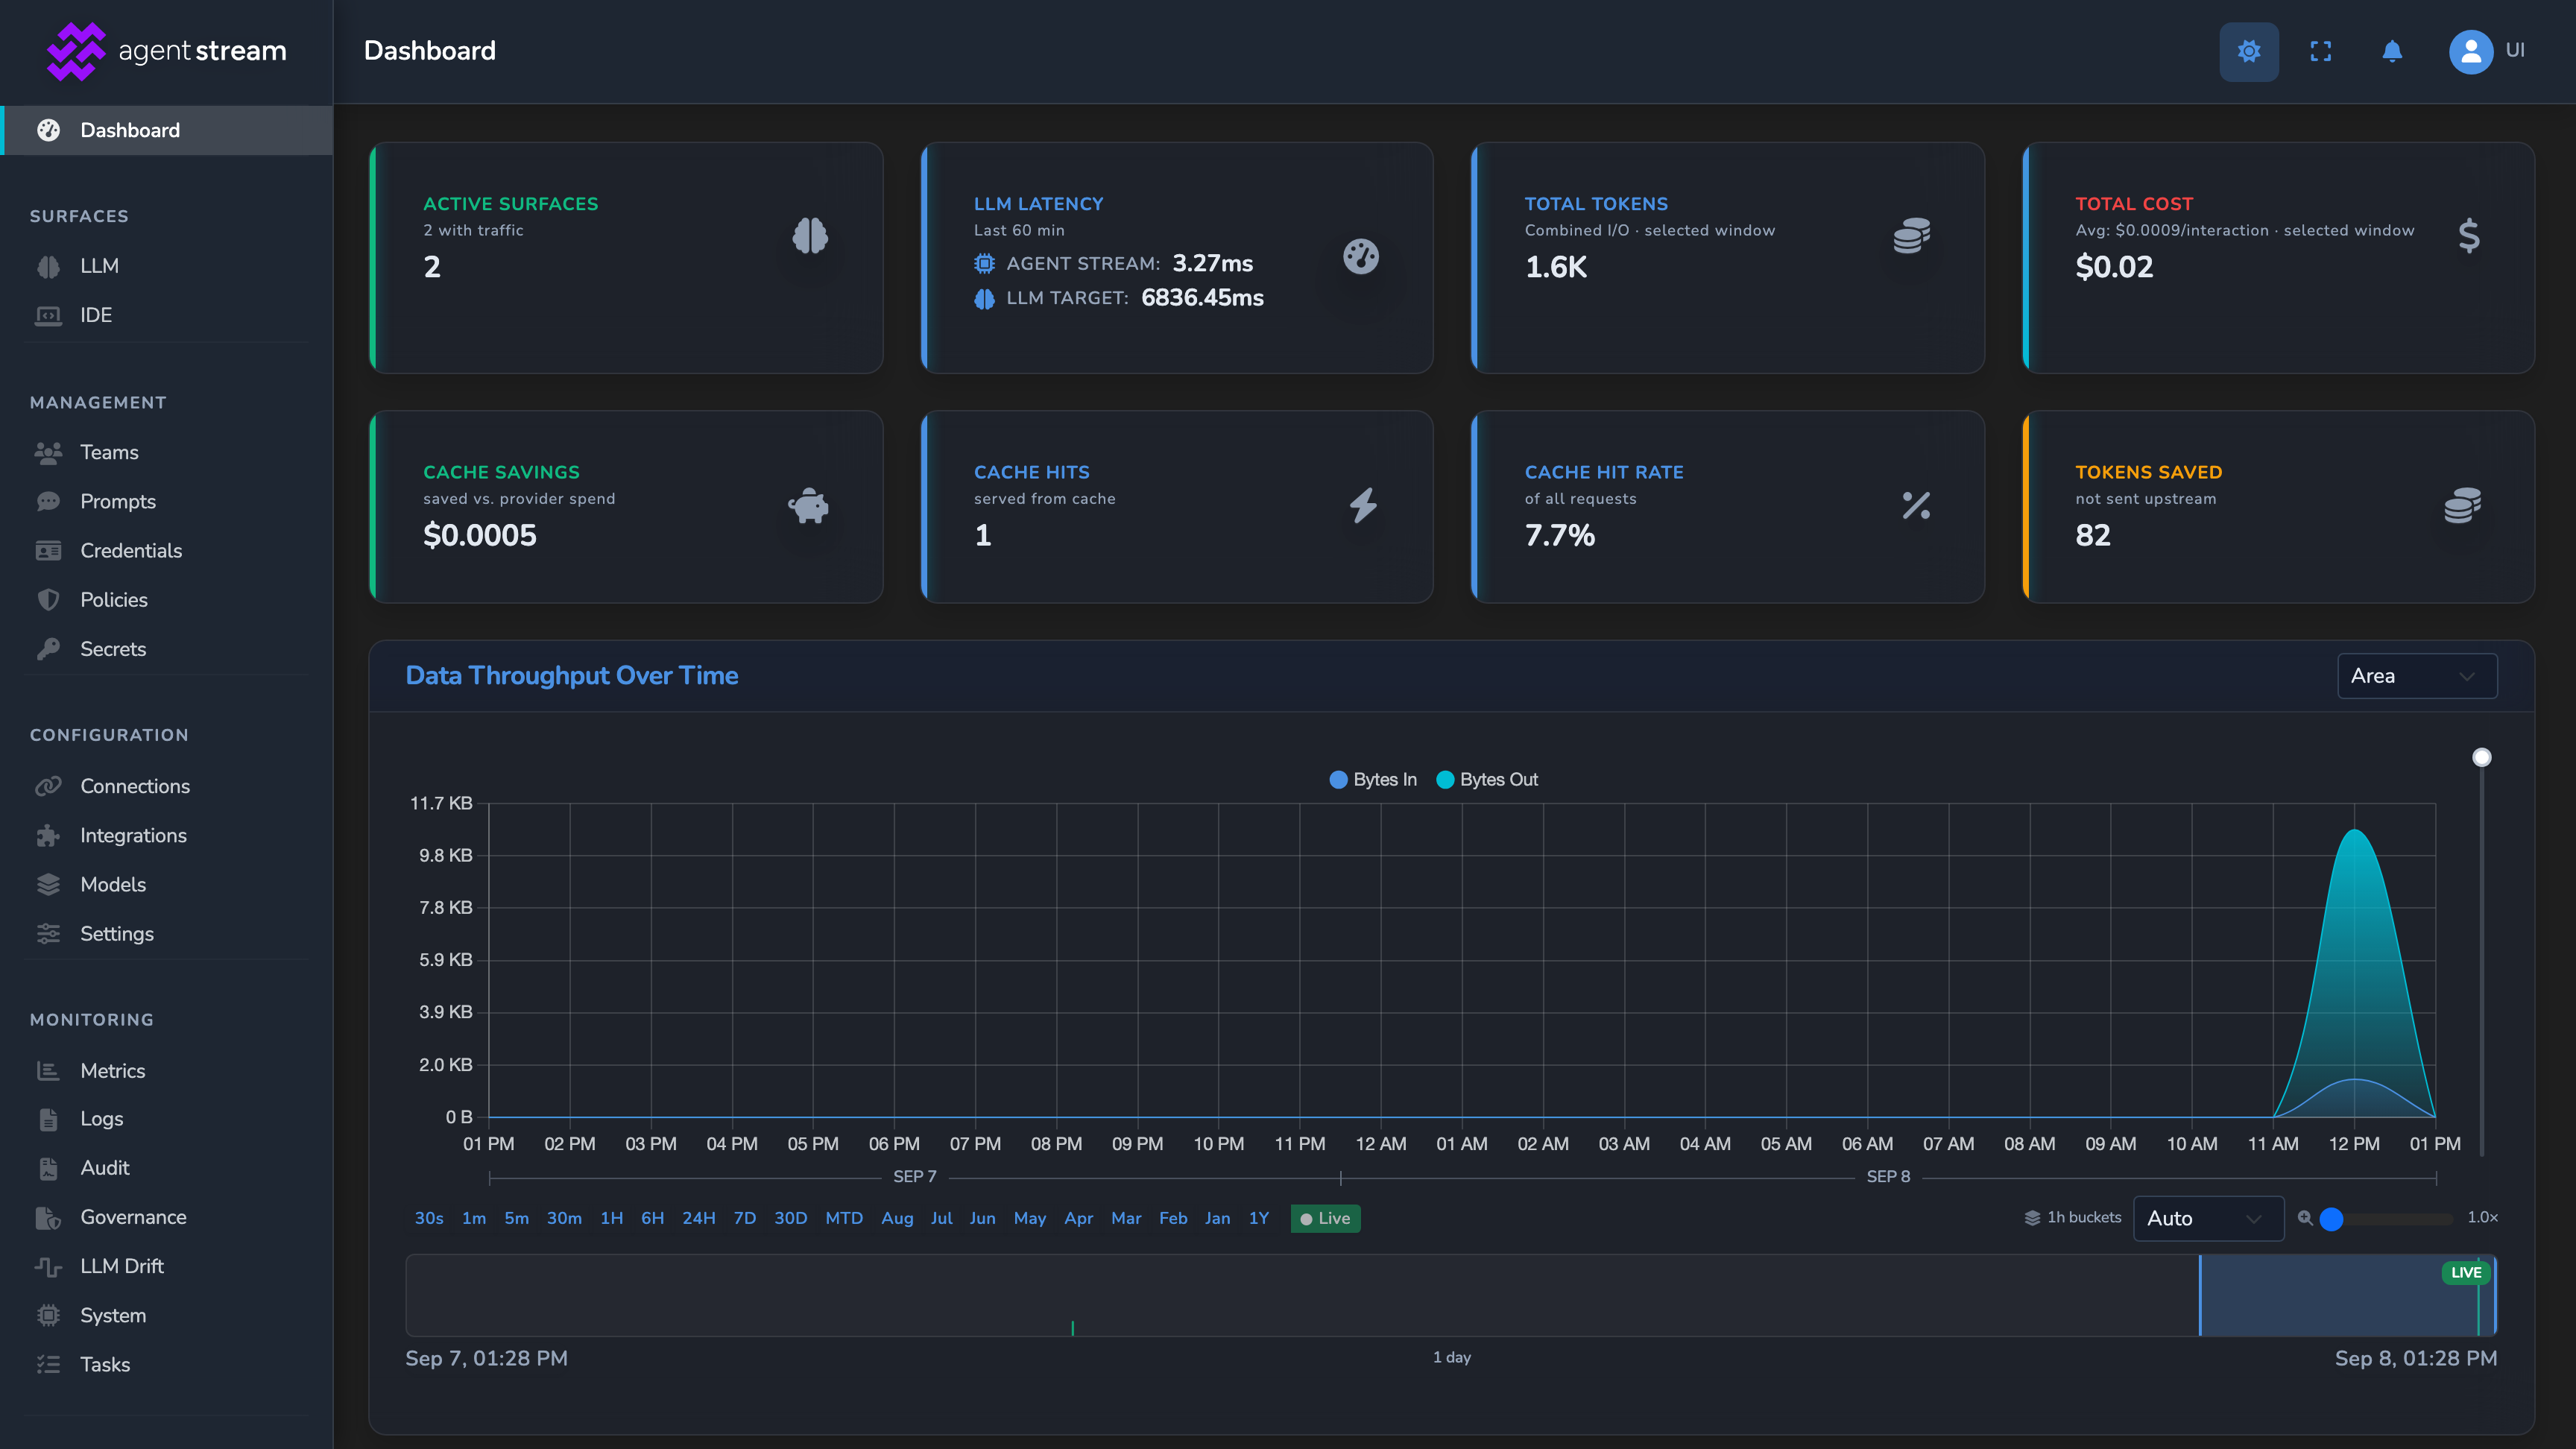
A real-time management dashboard shows cost, tokens, latency, and throughput, with per-surface breakdowns, and each surface has its own monitoring tab scoped to that surface alone. This is the fastest way to confirm traffic is flowing normally, spot which surface is driving cost, or see a rejection spike as it happens.
What comes back in response headers
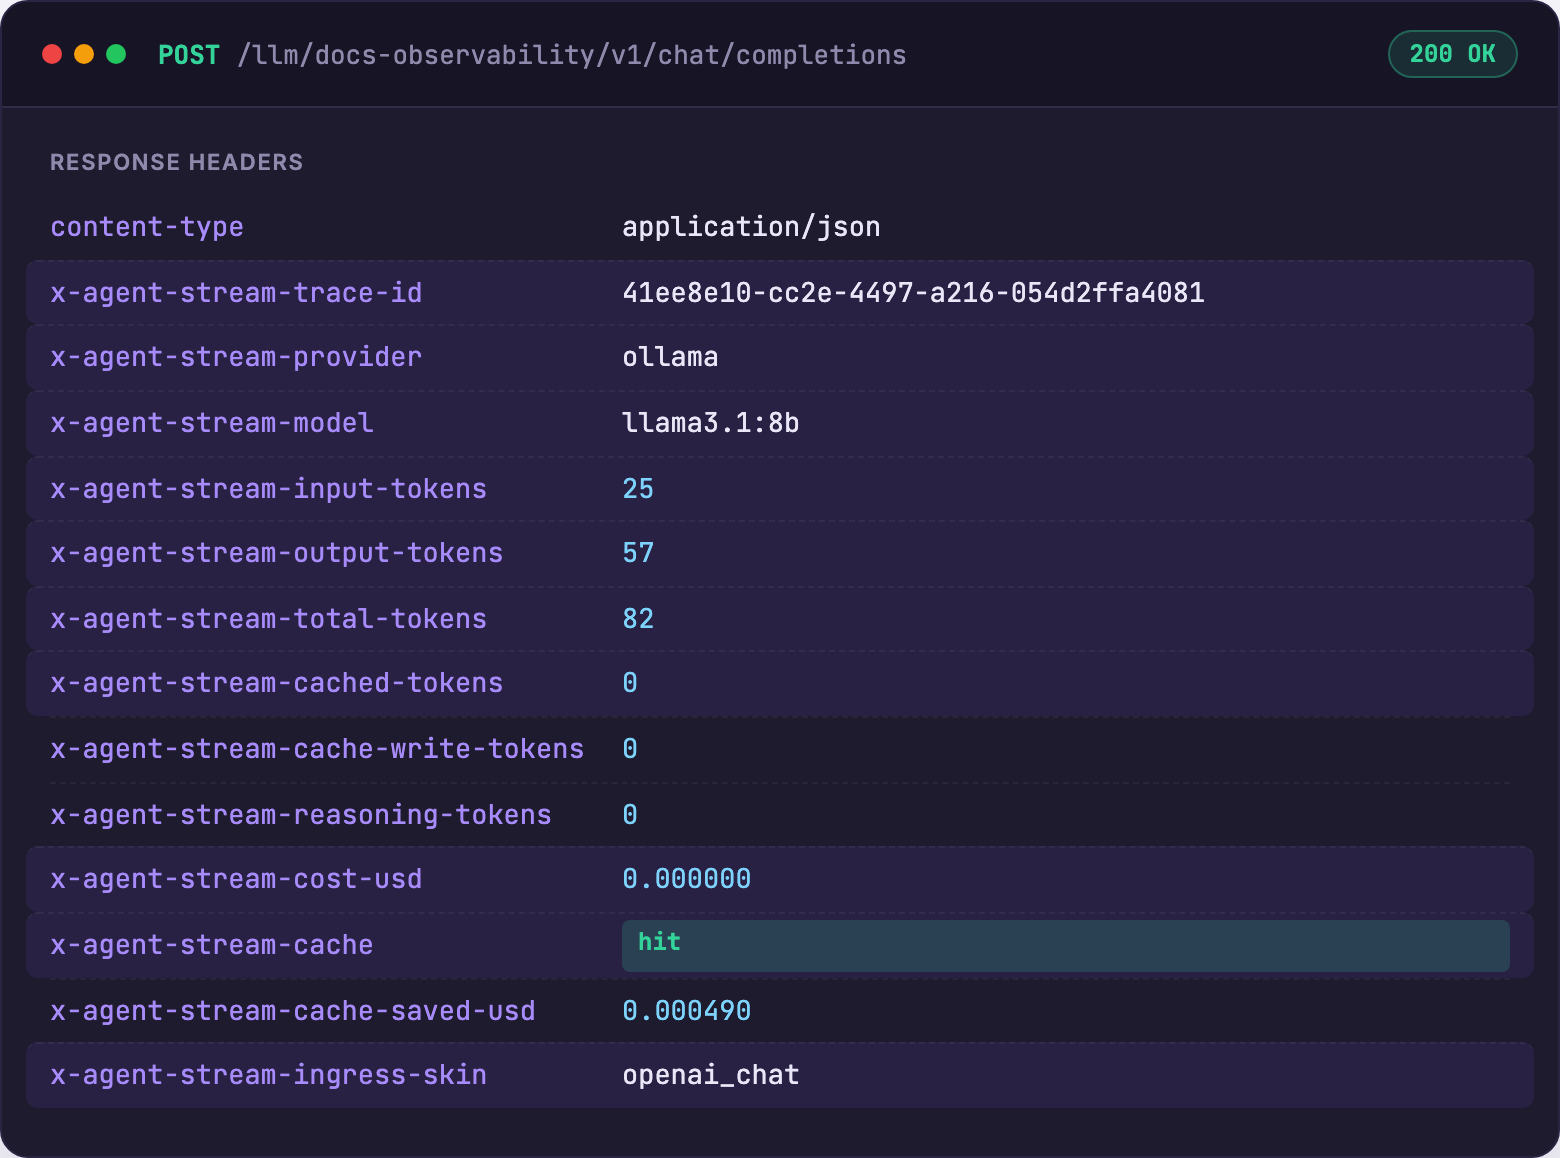
A buffered response carries x-agent-stream-* headers: trace ID, provider, model, tokens, cached-tokens, cost, cache hit or miss, and ingress skin. A client can read cost and usage figures directly from the response headers without parsing the body. A streamed response carries the request-time subset of the same headers.
Exporting to your own stack
Nothing here is locked to Agent Stream’s own dashboard. Each export channel carries a different signal:
| Channel | What it carries |
|---|---|
| OpenTelemetry (OTLP) | Traces, metrics, and audit logs such as policy decisions and governance records, to Datadog, Grafana, Jaeger, or any OTLP-compatible collector. |
| Prometheus scrape endpoint | Metrics. |
| Webhook integration | Events. |
Governance records reach OTLP only when the surface’s OpenTelemetry exporter switch is on, and Enable OpenTelemetry and Enable Log Export are both on in the OpenTelemetry tab of the Metrics Configuration page.
Why this matters
Usage telemetry and rejection counts carry the same identity context the rest of the platform uses: surface, stage, member, and team. A cost spike or a rejection spike can therefore be attributed to a specific surface or caller on the dashboard, rather than appearing as an undifferentiated failure.
Related
- Cost and usage governance: The budgets and alerts built on the same usage telemetry.
- Guardrails: The safety layers behind the rejection taxonomy.
- Governance records: The signed, per-interaction transcript that complements this operational telemetry.
- Teams and attribution: How telemetry rolls up to members and teams.
- LLM drift detection: The dedicated dimension charts that sit alongside this operational telemetry.
Glad to hear it. Thanks for letting us know.
Sorry to hear that. Thanks for letting us know.