LLM drift detection
A provider can update a model behind an API, a prompt edit can alter responses, or quality can decline gradually while every request still succeeds. LLM drift detection measures these changes by sampling live traffic, tracking defined behaviour dimensions, and comparing each current window with a pinned baseline. Replay evaluation runs captured sessions through the same or another Surface, so you can investigate a regression or assess a model, prompt, or safety-pipeline change before changing production traffic. Governance records →
Drift monitoring
Drift monitoring compares an LLM Surface’s current behaviour with its approved baseline. A model can continue to return successful responses while becoming slower, more expensive, more likely to refuse requests, less safe, or less semantically consistent. The comparison makes these changes visible before they become difficult to trace to a particular model, prompt, retrieval, or configuration change.
It samples real interactions and tracks key behaviour dimensions such as:
- Refusal rate
- Safety-flag rate
- Latency
- Response length
- Output tokens
- Cost
- Schema validity
- Semantic stability (quality score & semantic distance).
These measurements are stored over time and compared against a pinned baseline for that surface. The main purpose is operational awareness: detect behavioural change, compare it to a known-good baseline, and optionally trigger alerts or block problematic changes from being saved.
How drift monitoring is switched on
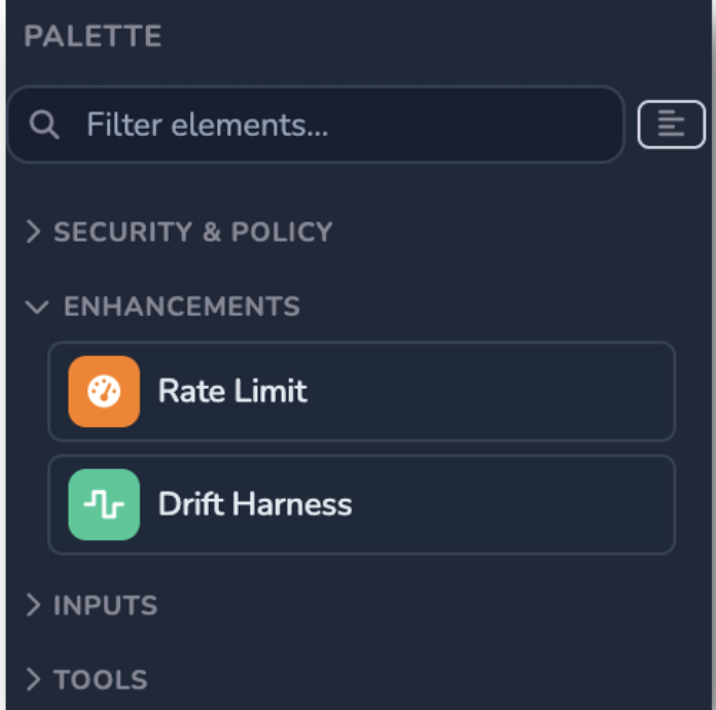
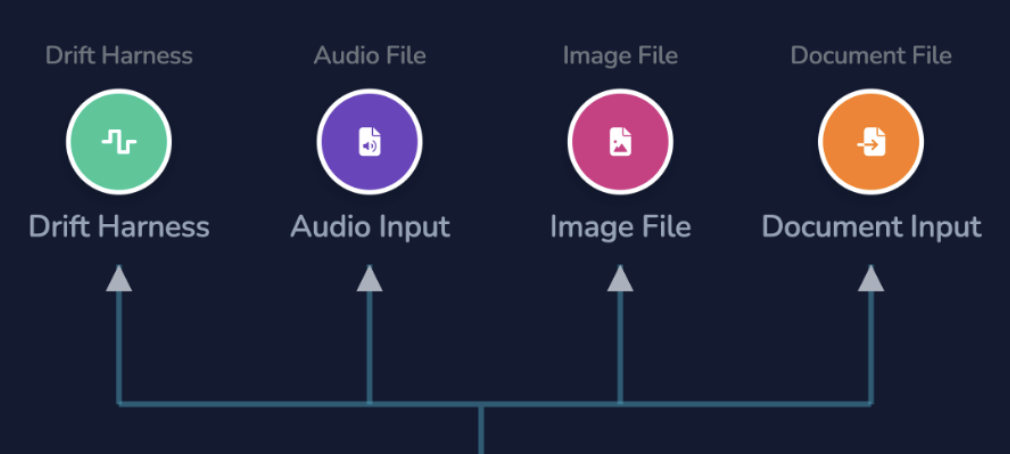
Drift monitoring is off by default. It is switched on per LLM Surface through the Drift Harness, an enhancement that sits on the surface’s LLM node in the surface builder. Its Monitor drift switch starts deriving dimensions from sampled traffic, and its full-page editor holds the surface’s monitoring, replay evaluation, and alert settings. The same sampled interactions provide the prompts and completions used by replay evaluation.
The sample rate is the percentage of live Surface traffic captured for monitoring and replay. It starts at 100%, which samples every interaction. A lower rate reduces the volume of captured sessions on high-traffic Surfaces while retaining a representative workload.
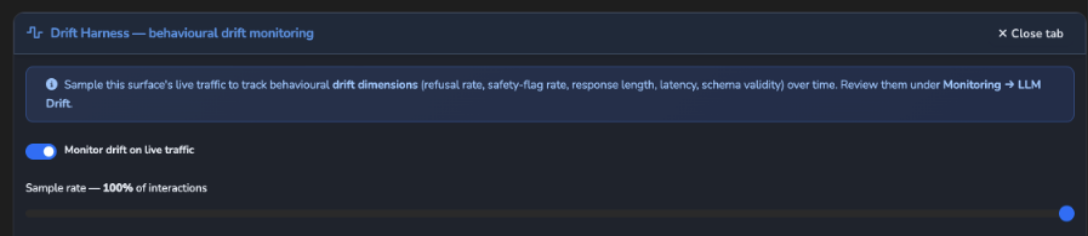
A suitable rate reflects the traffic volume, evaluation needs, and cost of replaying captured sessions. The selected rate determines how much live traffic contributes to the monitoring data and replay corpus.
The Warn threshold and Drift threshold classify changes from the baseline:

The LLM Drift page, under Monitoring in the sidebar, is where the results appear. It has three tabs:
- Drift over time charts each dimension for the selected surface against its pinned baseline, and carries Set baseline.
- Evaluation runs a replay evaluation and shows its outcome.
- History lists recent replay evaluations, manual or scheduled, across all surfaces.
By default, only an Administrator can open the page.
Drift dimensions
Each dimension is its own time-series line, so a surface can drift on one axis while staying stable on the others:
| Dimension | Measures | Source |
|---|---|---|
| Quality score | Answer-stability rate: how close a replayed answer stays to the one originally captured | Replay evaluation only |
| Refusal rate | Fraction of responses that read as a refusal | Production sampling |
| Safety-flag rate | Fraction of interactions blocked or flagged by Judge, Jury, or an expert witness | Production sampling |
| Response length | Mean completion length, in characters | Production sampling |
| Output tokens | Mean completion length, in tokens | Production sampling |
| Cost | Mean cost per call, in USD | Production sampling |
| Latency | Mean end-to-end gateway latency | Production sampling |
| Schema validity | Structured-output conformance rate, for requests that asked for one | Production sampling |
| Semantic distance | Mean embedding distance between a replayed answer and the originally-captured one | Replay evaluation only |
Every dimension marked Production sampling above derives from data the gateway already produces on the request path, so it fills in from ordinary traffic with no extra cost or dataset. Quality score and semantic distance are graphable only once a replay evaluation has actually run against the surface’s captured sessions. Response length, refusal rate, and the session capture that feeds replay evaluation all need the completion text. A buffered call provides it whenever the reply contains text. A streamed call provides it only when Agent Stream reassembles the stream, which happens when the surface records streamed interactions in its governance records or stores the answer in its response cache. Schema validity comes from buffered calls only, and a streamed call always counts as unflagged in the safety-flag rate.
Replay evaluation requires an embeddings model to calculate semantic distance. Without one, semantic distance stays empty and every replayed answer counts as stable in the quality score. A dimension with no eligible samples or no pinned baseline has unknown status, rather than stable or drift. Quality score and semantic distance remain unpopulated until a replay evaluation runs.
Baselines and the warn/drift verdict
A baseline is a snapshot: pressing Set baseline pins the mean of each dimension over the window that is current at that moment as the surface’s “normal.” Every later window is compared back to it as a relative change, classified against two per-surface thresholds (25% and 50% by default): within the warn threshold is stable, past it but short of the drift threshold is warn, and past the drift threshold is drift. The surface’s overall status is always its worst dimension, so one regressing axis is enough to flag the whole surface. A near-zero baseline (an idle refusal rate of 0, say) is floored per dimension before the relative change is computed, so a tiny absolute move can’t read as infinite drift.

A surface can optionally block saves on regression: while it is drifting past its baseline, saving its configuration is refused until the baseline is re-pinned or the guardrail is turned off, so a change can’t ship over an unacknowledged regression.
Alerting through Integrations
Every drift-monitored surface with a pinned baseline is evaluated every 5 minutes against its trailing hour of traffic. Crossing into drift fires a drift.detected event carrying the surface, its overall status, the worst-drifting dimension with its baseline, current value, and delta, and the verdict for every dimension. It routes through the same Integrations subsystem used elsewhere in Agent Stream, to the integrations chosen under Alert integrations, which lists integrations created in the LLM Drift category, or to the surface’s own event mappings when none are chosen.
While the surface stays in drift, the alert re-fires on the surface’s Alert cadence: no more often than Re-alert every (minutes), up to Max alerts per baseline times while it stays in drift, where 0 means no limit. When the surface leaves drift, a drift.resolved event fires through the same routing, and the next entry into drift starts a new alert sequence.
Replay evaluation and cross-surface comparison
While monitoring is on, sampled interactions are also captured as indicative sessions: real prompts and completions, retained per surface. A replay evaluation, run on demand from the Evaluation tab or on a schedule with Run automatically (at most once every 5 minutes), re-executes those captured sessions through a surface’s full governed pipeline and compares each new answer to the one originally captured. A completed self-run, where the target is the source surface itself with no variant, folds its measurements into that surface’s dimensions, including quality score and semantic distance.
Each replayed session is a real upstream call, billed to the target surface and counted against its usage limits. A run replays at most Max sessions per run sessions, and stops part-way once it reaches the surface’s Cost ceiling per run or the target surface’s usage limits. A blank cost ceiling uses the appliance default, and 0 removes it. A run in progress can be cancelled. When evaluation runs fail several times in a row, scheduled runs are suspended, and a successful manual run clears the suspension and resumes the schedule.
Testing and evaluating other models and configurations
The replay separates the source of the captured sessions (Surface Source Data to Replay) from the target surface or variant that actually executes them (Evaluation Target Surface and Target Variant), defaulting to the same surface as a self-check. Pointing the target at a different surface or variant replays real, previously-captured traffic through a different model, prompt, or Judge/Jury pipeline: an evidence-based way to see how a candidate change would have performed before switching over. A self-run, on the source surface itself with no variant, folds into the surface’s own dimensions; a cross-surface run is inspect-only, shown and saved to run history without touching the baseline it is compared against.
Enterprise use cases
- Provider and model changes. Replay captured sessions through a candidate surface or variant before changing production routing.
- Prompt and pipeline changes. Examine the effect of prompt, model, Judge, Jury, or Expert Witness changes against a representative workload.
- Operational monitoring. Watch customer-facing or compliance-sensitive surfaces for changes in latency, cost, refusals, safety flags, schema validity, or semantic stability.
- Governance and incident response. Use baselines, dimension history, replay results, and drift alerts as evidence when investigating a change in AI behaviour.
Retention
Each surface keeps a limited history of captured sessions and runs, and the oldest are removed as new ones are recorded. Both are encrypted at rest.
Why this matters
Drift dimensions turn a silent model update or a slow quality regression into a graph, not a customer complaint:
- Sampling from data the gateway already produces means the production-sampling dimensions above cost nothing extra to collect.
- Cross-surface replay means an upgrade decision, a new model, a tweaked prompt, a different Judge or Jury, can be tested against a surface’s own real, captured workload instead of a guess.
Related
- Variants and progressive rollout: How a cross-surface replay’s target surface or variant compares to routing rules and canary splits as a way to evaluate a change.
- Observability: How drift’s dimension charts stay on their own dedicated page rather than the main telemetry dashboard.
- Cost and usage governance: How a replay run spends through the same budgets and limits as any other call.
- Surfaces: Where the Drift Harness sits alongside a surface’s other optional configuration.
- Governance records: The signed, per-interaction transcript that drift monitoring’s sampled traffic complements.
Glad to hear it. Thanks for letting us know.
Sorry to hear that. Thanks for letting us know.