Tasks
The Tasks page shows the runtime status of all surface listeners, connection points, and MCP proxies. Use it to confirm that listeners are up and accepting connections before diagnosing call failures elsewhere. A surface task in any status other than Running, or a connection point in any status other than Connected, means that listener is down and will not accept inbound calls.
Access the Tasks page from the dashboard sidebar under Tasks.
What the Tasks page shows
Surface Tasks is always present. Connection Point Tasks and MCP Proxy Tasks appear only when tasks of that type exist.
Surface tasks
Each surface produces one task per listener. Access Point listeners and Transit Point listeners each appear as a separate row. Rows are grouped by surface; select the group header to expand or collapse it.
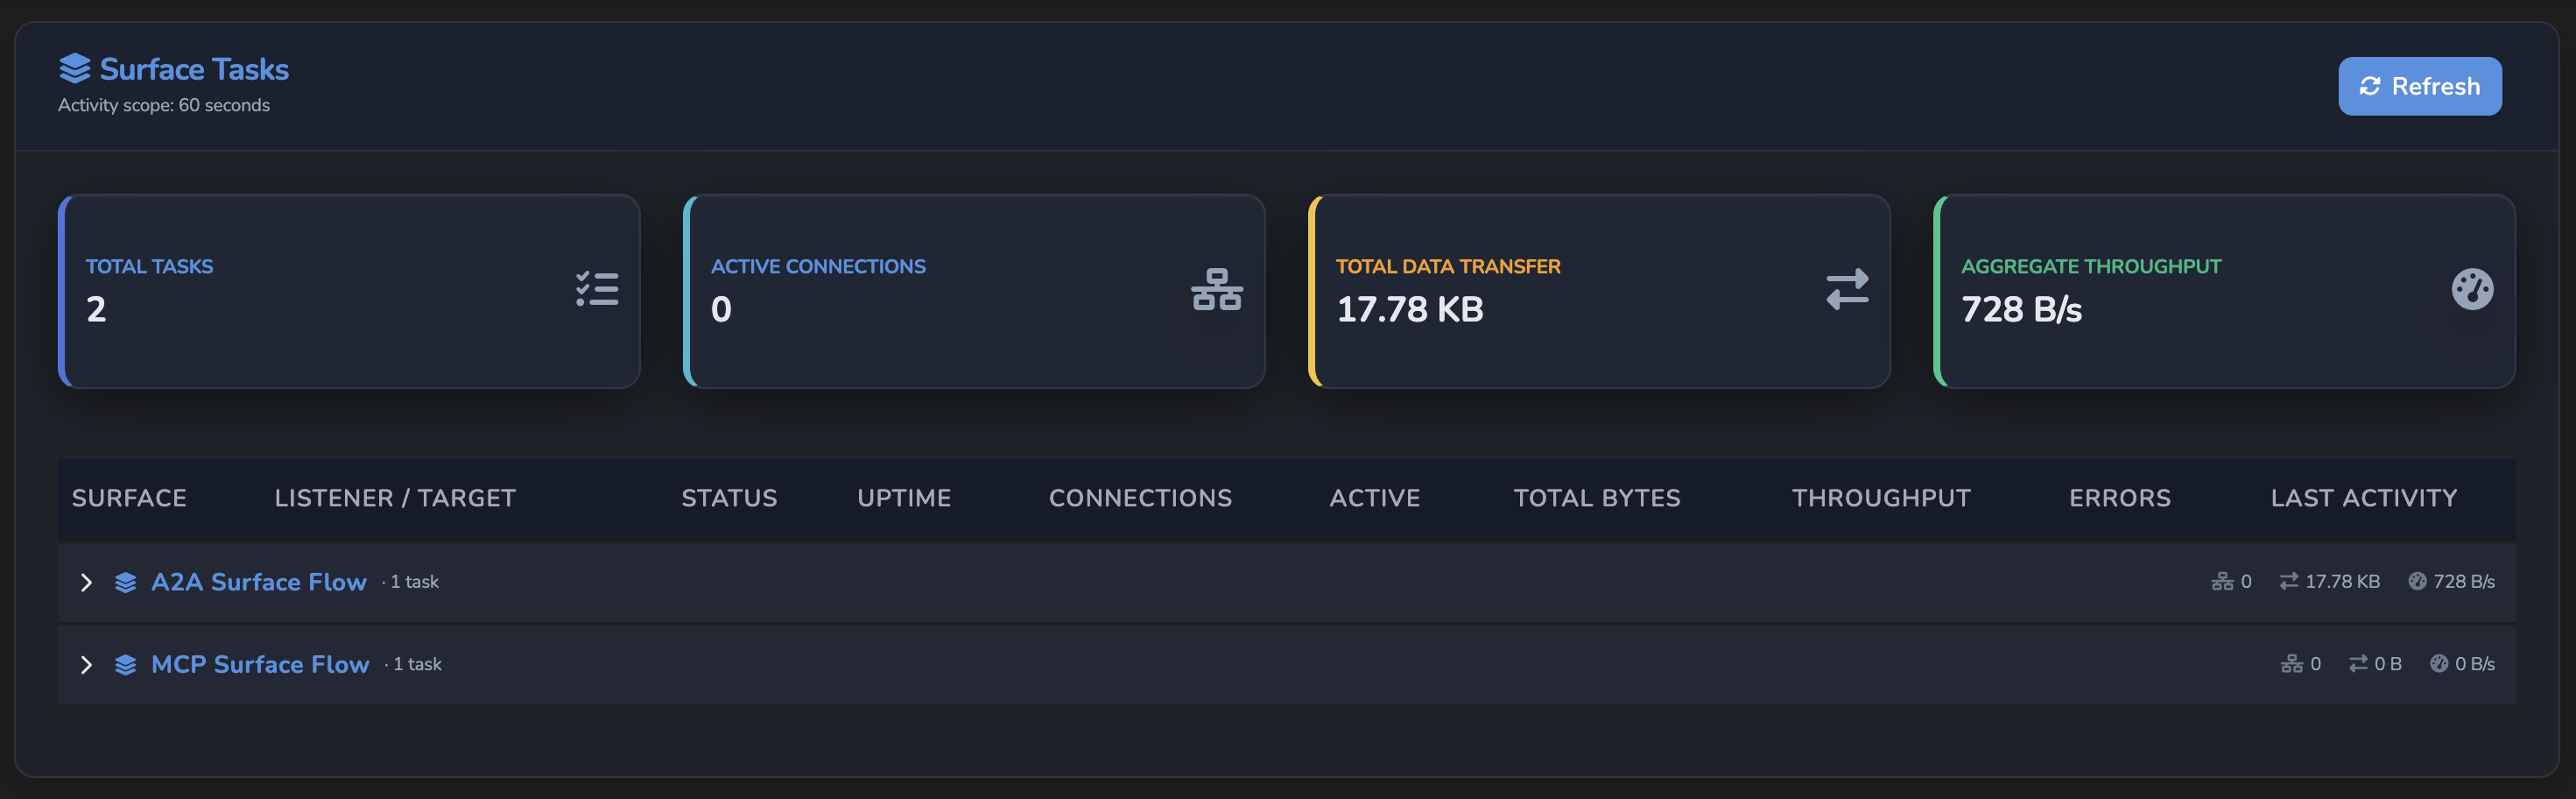
Summary cards above the table show gateway-wide totals for the current session:
| Card | Description |
|---|---|
| Total Tasks | Number of registered channel task listeners. |
| Active Connections | Total live connections across all tasks right now. |
| Total Data Transfer | Cumulative bytes sent and received across all tasks. |
| Aggregate Throughput | Combined bytes per second across all task metrics. |
Tag filter: when surfaces have tags, a tag filter appears above the table. Selecting one or more tags shows only groups for surfaces that carry those tags.
Group header row: each surface appears as a collapsible header showing the surface name, tags, and aggregate stats: active connections, total bytes, throughput, and an error count highlighted in red when greater than zero. Select the surface name to open the surface.
Task row columns:
| Column | Description |
|---|---|
| Surface | The access point or transit point name, with a badge indicating its role (Access Point or Transit Point) and protocol. |
| Listener / Target | The listener address and the target endpoint this task proxies traffic to. |
| Status | Current task status: Running, Starting, Stopping, or Error. |
| Uptime | Time elapsed since the task listener started. |
| Connections | Total connection count for this task since it started. |
| Active | Number of connections currently open (highlighted in blue when greater than zero). |
| Total Bytes | Combined bytes sent and received by this task. |
| Throughput | Current data transfer rate in bytes per second. Drops to 0 B/s within five seconds of no activity. |
| Errors | Error count since the task started (highlighted in red when greater than zero). |
| Last Activity | Relative time since this task last processed traffic (for example, “3m ago”). |
Connection point tasks
This section lists the WebSocket listener task for each connection point. It is shown only when at least one connection point task exists.
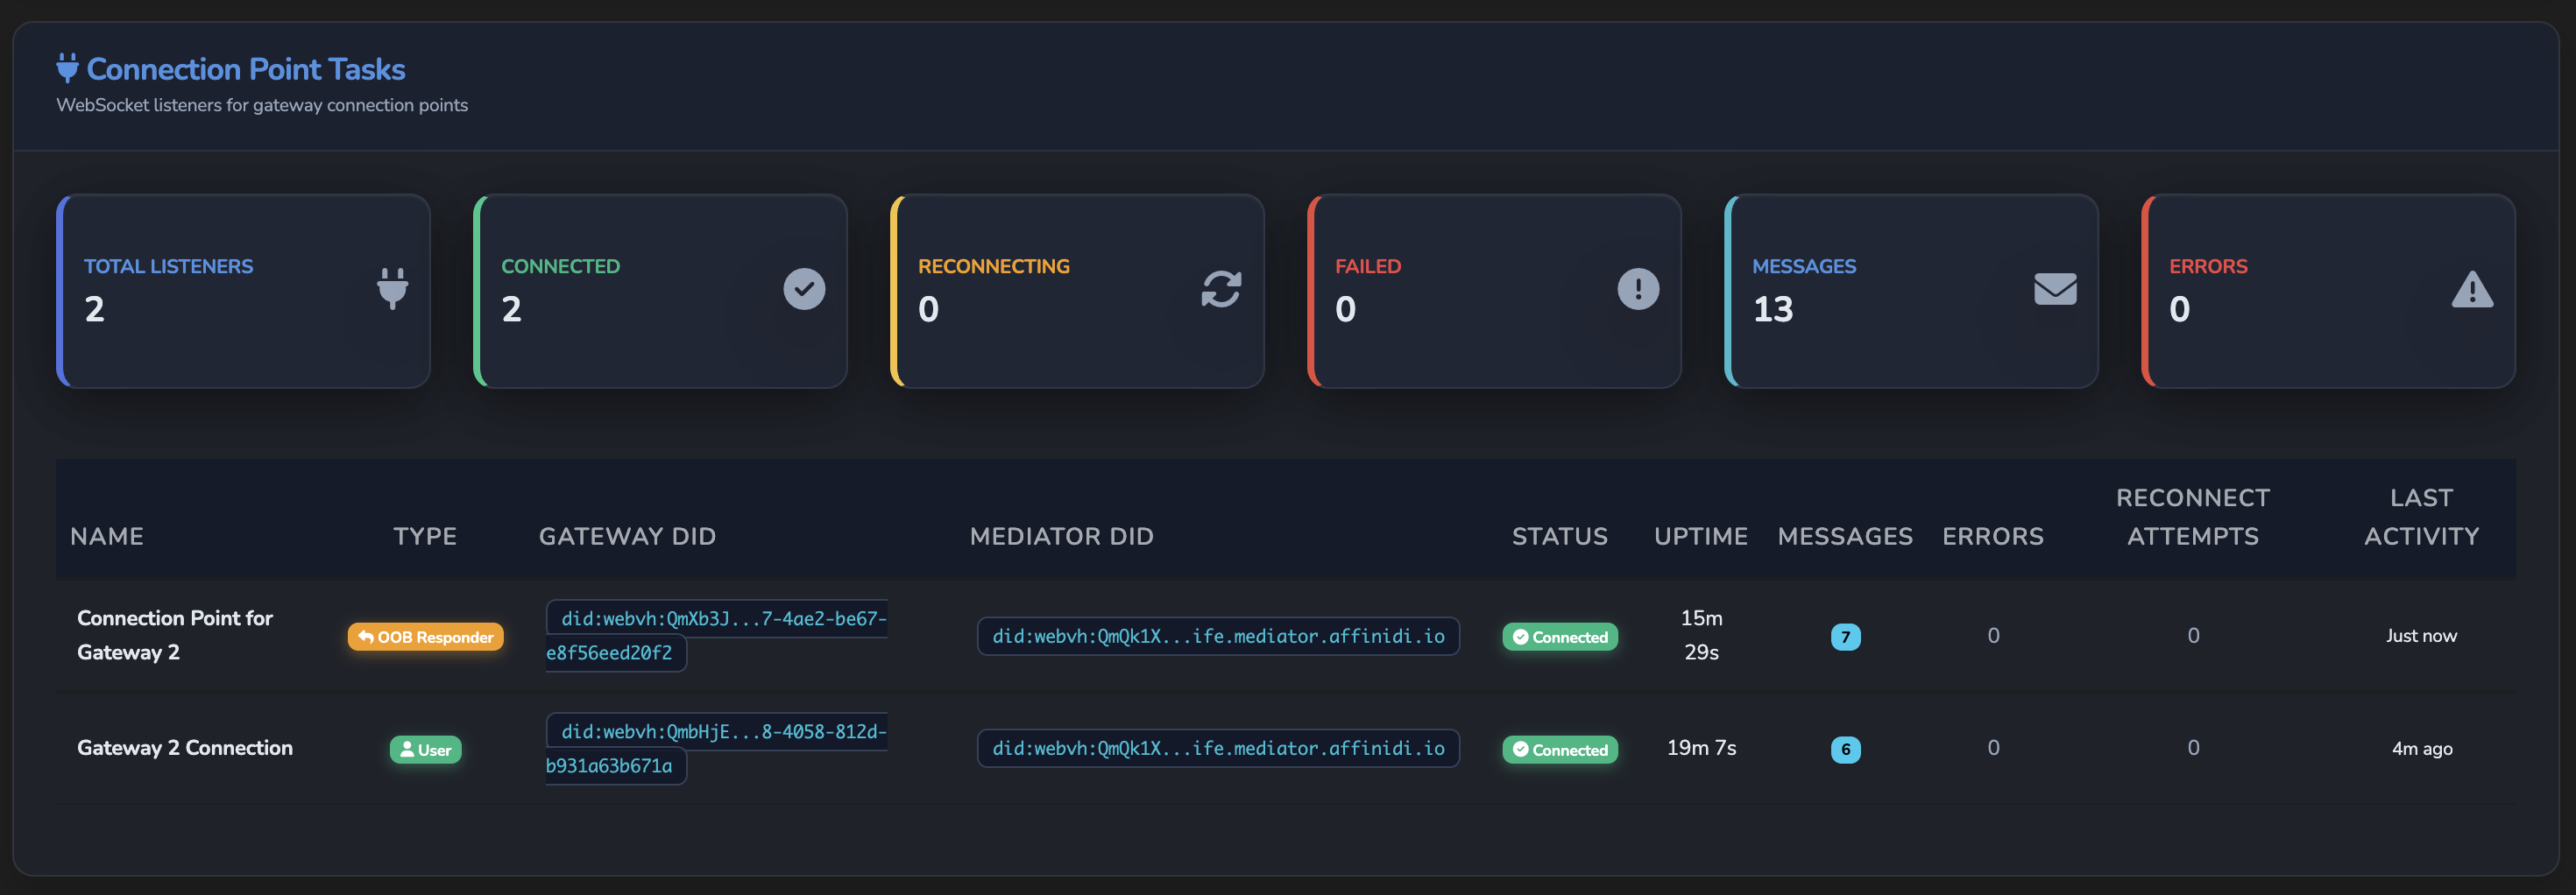
Summary cards:
| Card | Description |
|---|---|
| Total Listeners | Number of connection point listener tasks registered. |
| Connected | Listeners with an open WebSocket to the mediator. |
| Reconnecting | Listeners that lost their connection and are retrying. |
| Failed | Listeners that could not re-establish a connection. |
| Messages | Total DIDComm messages handled across all connection points. |
| Errors | Total errors across all connection points. |
Task row columns:
| Column | Description |
|---|---|
| Name | The name of the connection point. |
| Type | How this connection point was created: User (manually created), OOB Inviter (permanent connection from an out-of-band invitation, inviter side), OOB Responder (auto-created to receive messages from an OOB acceptor), OOB Acceptor (gateway listener endpoint on the acceptor side), or System (legacy). |
| Gateway DID | The DID of this gateway for this connection (truncated). |
| Mediator DID | The mediator DID used by this connection point (truncated). |
| Status | Current status: Connected, Reconnecting, or Failed. |
| Uptime | Time elapsed since the connection point task started. |
| Messages | Total DIDComm messages handled by this connection point. |
| Errors | Error count for this connection point. |
| Reconnect Attempts | How many times this connection has attempted to reconnect (highlighted in amber when greater than zero). A non-zero value indicates the underlying WebSocket to the mediator is unstable. |
| Last Activity | Relative time since this connection point last handled a message. |
MCP proxy tasks
This section lists all MCP proxy registrations. It is shown only when at least one MCP proxy exists.
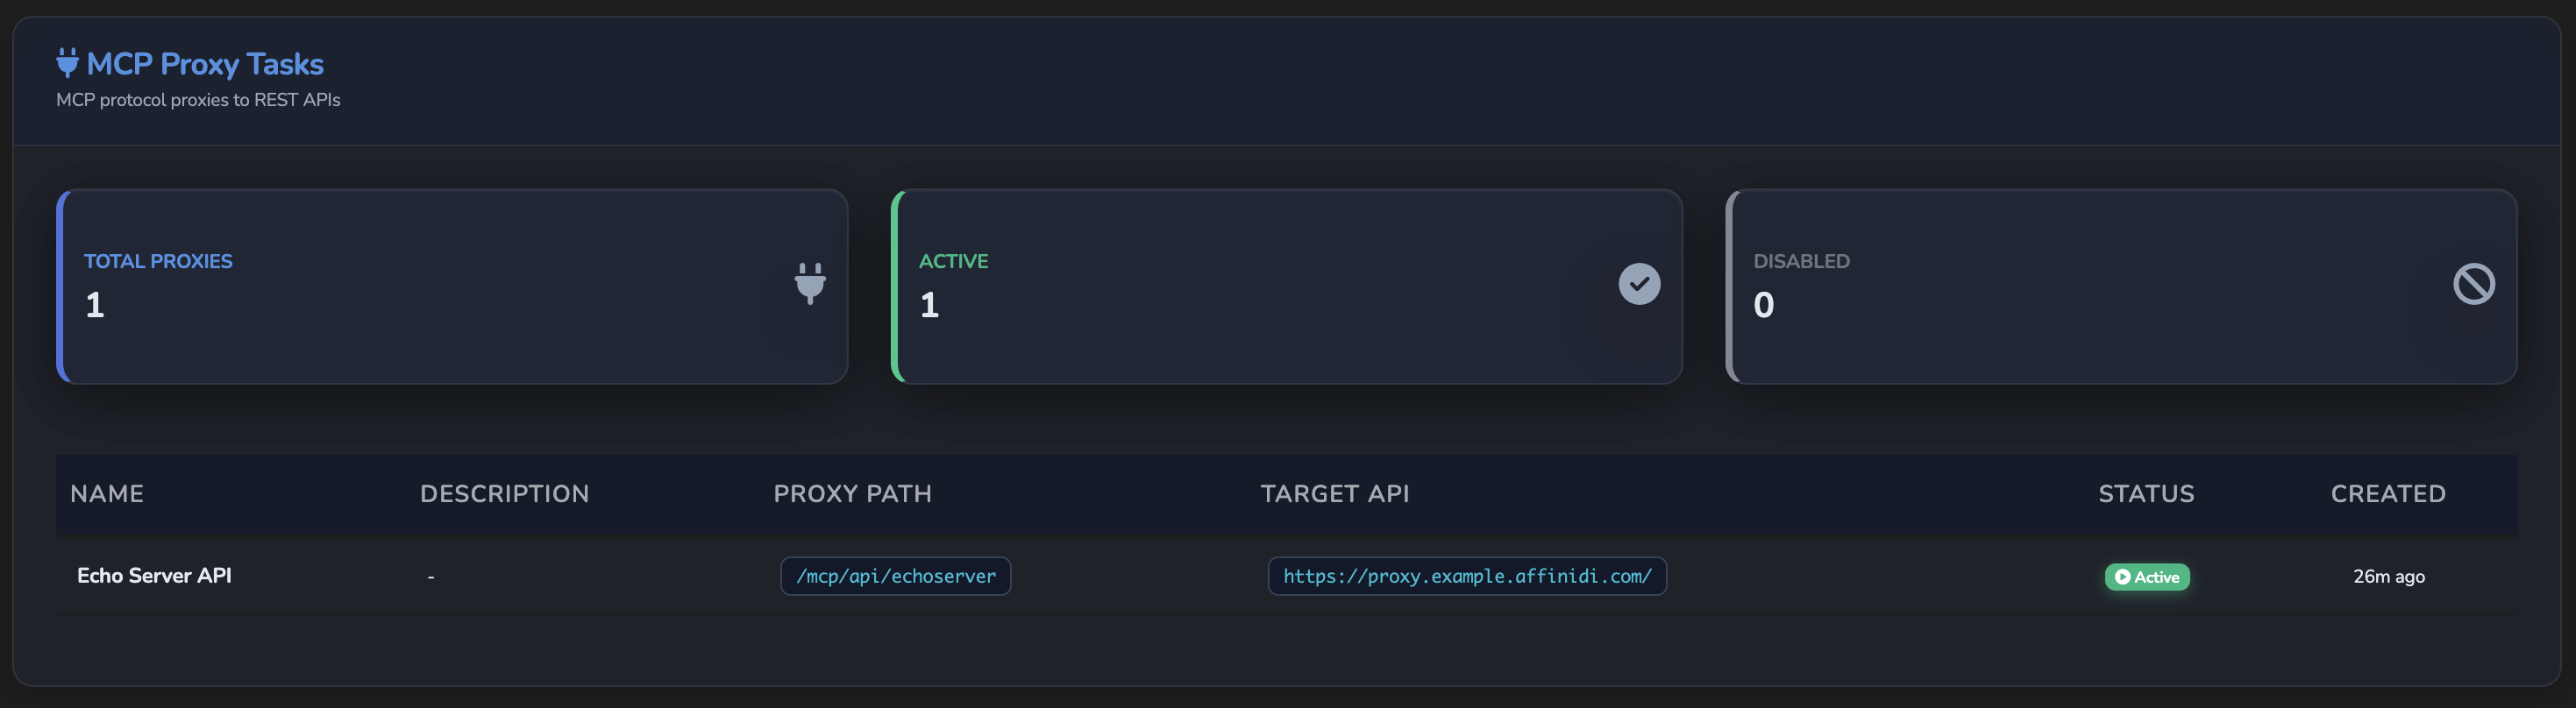
Summary cards:
| Card | Description |
|---|---|
| Total Proxies | Number of MCP proxies registered on this gateway. |
| Active | Proxies currently accepting tool calls. |
| Disabled | Proxies that exist but are not currently active. |
Task row columns:
| Column | Description |
|---|---|
| Name | The name given to this MCP proxy. |
| Description | Optional description set when the proxy was created. |
| Proxy Path | The URL path prefix under which this proxy is mounted. |
| Target API | The base URL of the REST API this proxy translates tool calls to. |
| Status | Current status: Active or Disabled. |
| Created | How long ago this proxy was registered. |
Live updates and refresh
The page receives task updates via the WebSocket connection the dashboard maintains. No manual action is needed to see current data. Select Refresh to perform a full page reload if the displayed state appears stale.
Troubleshooting
| Symptom | Likely cause | Fix |
|---|---|---|
| A surface task row shows Error status. | The port listener failed to start or encountered a fatal error. | Open the surface and check the access point configuration. Review recent log entries for the surface name. |
| A connection point task shows Reconnecting or Failed status with a non-zero Reconnect Attempts count. | The WebSocket to the mediator is unstable or unreachable. | Check network connectivity to the mediator DID shown in the Mediator DID column. Review the Logs page for connection error details. |
| Connection Point Tasks or MCP Proxy Tasks section is not visible. | No tasks of that type exist. | These sections only appear when tasks are present. Create a connection point or MCP proxy to populate the relevant section. |
Related
- Observability: Per-surface monitoring charts and how to drill down from the gateway-wide home screen.
- Settings: Configure the task activity window.
Glad to hear it! Please tell us how we can improve more.
Sorry to hear that. Please tell us how we can improve.
Thank you for sharing your feedback so we can improve your experience.