Settings
The Settings page is the central configuration area for the management dashboard. It is organised into seven tabs. Every signed-in user sees User and Limits. Administrators also see System, Admin, Networking, and Security. Users with the users.view permission also see Users. Use it to tune system performance windows, configure Prometheus scraping credentials, run backups, manage user accounts, check appliance resource usage, and set personal dashboard display preferences.
Access Settings from the dashboard sidebar under Settings.
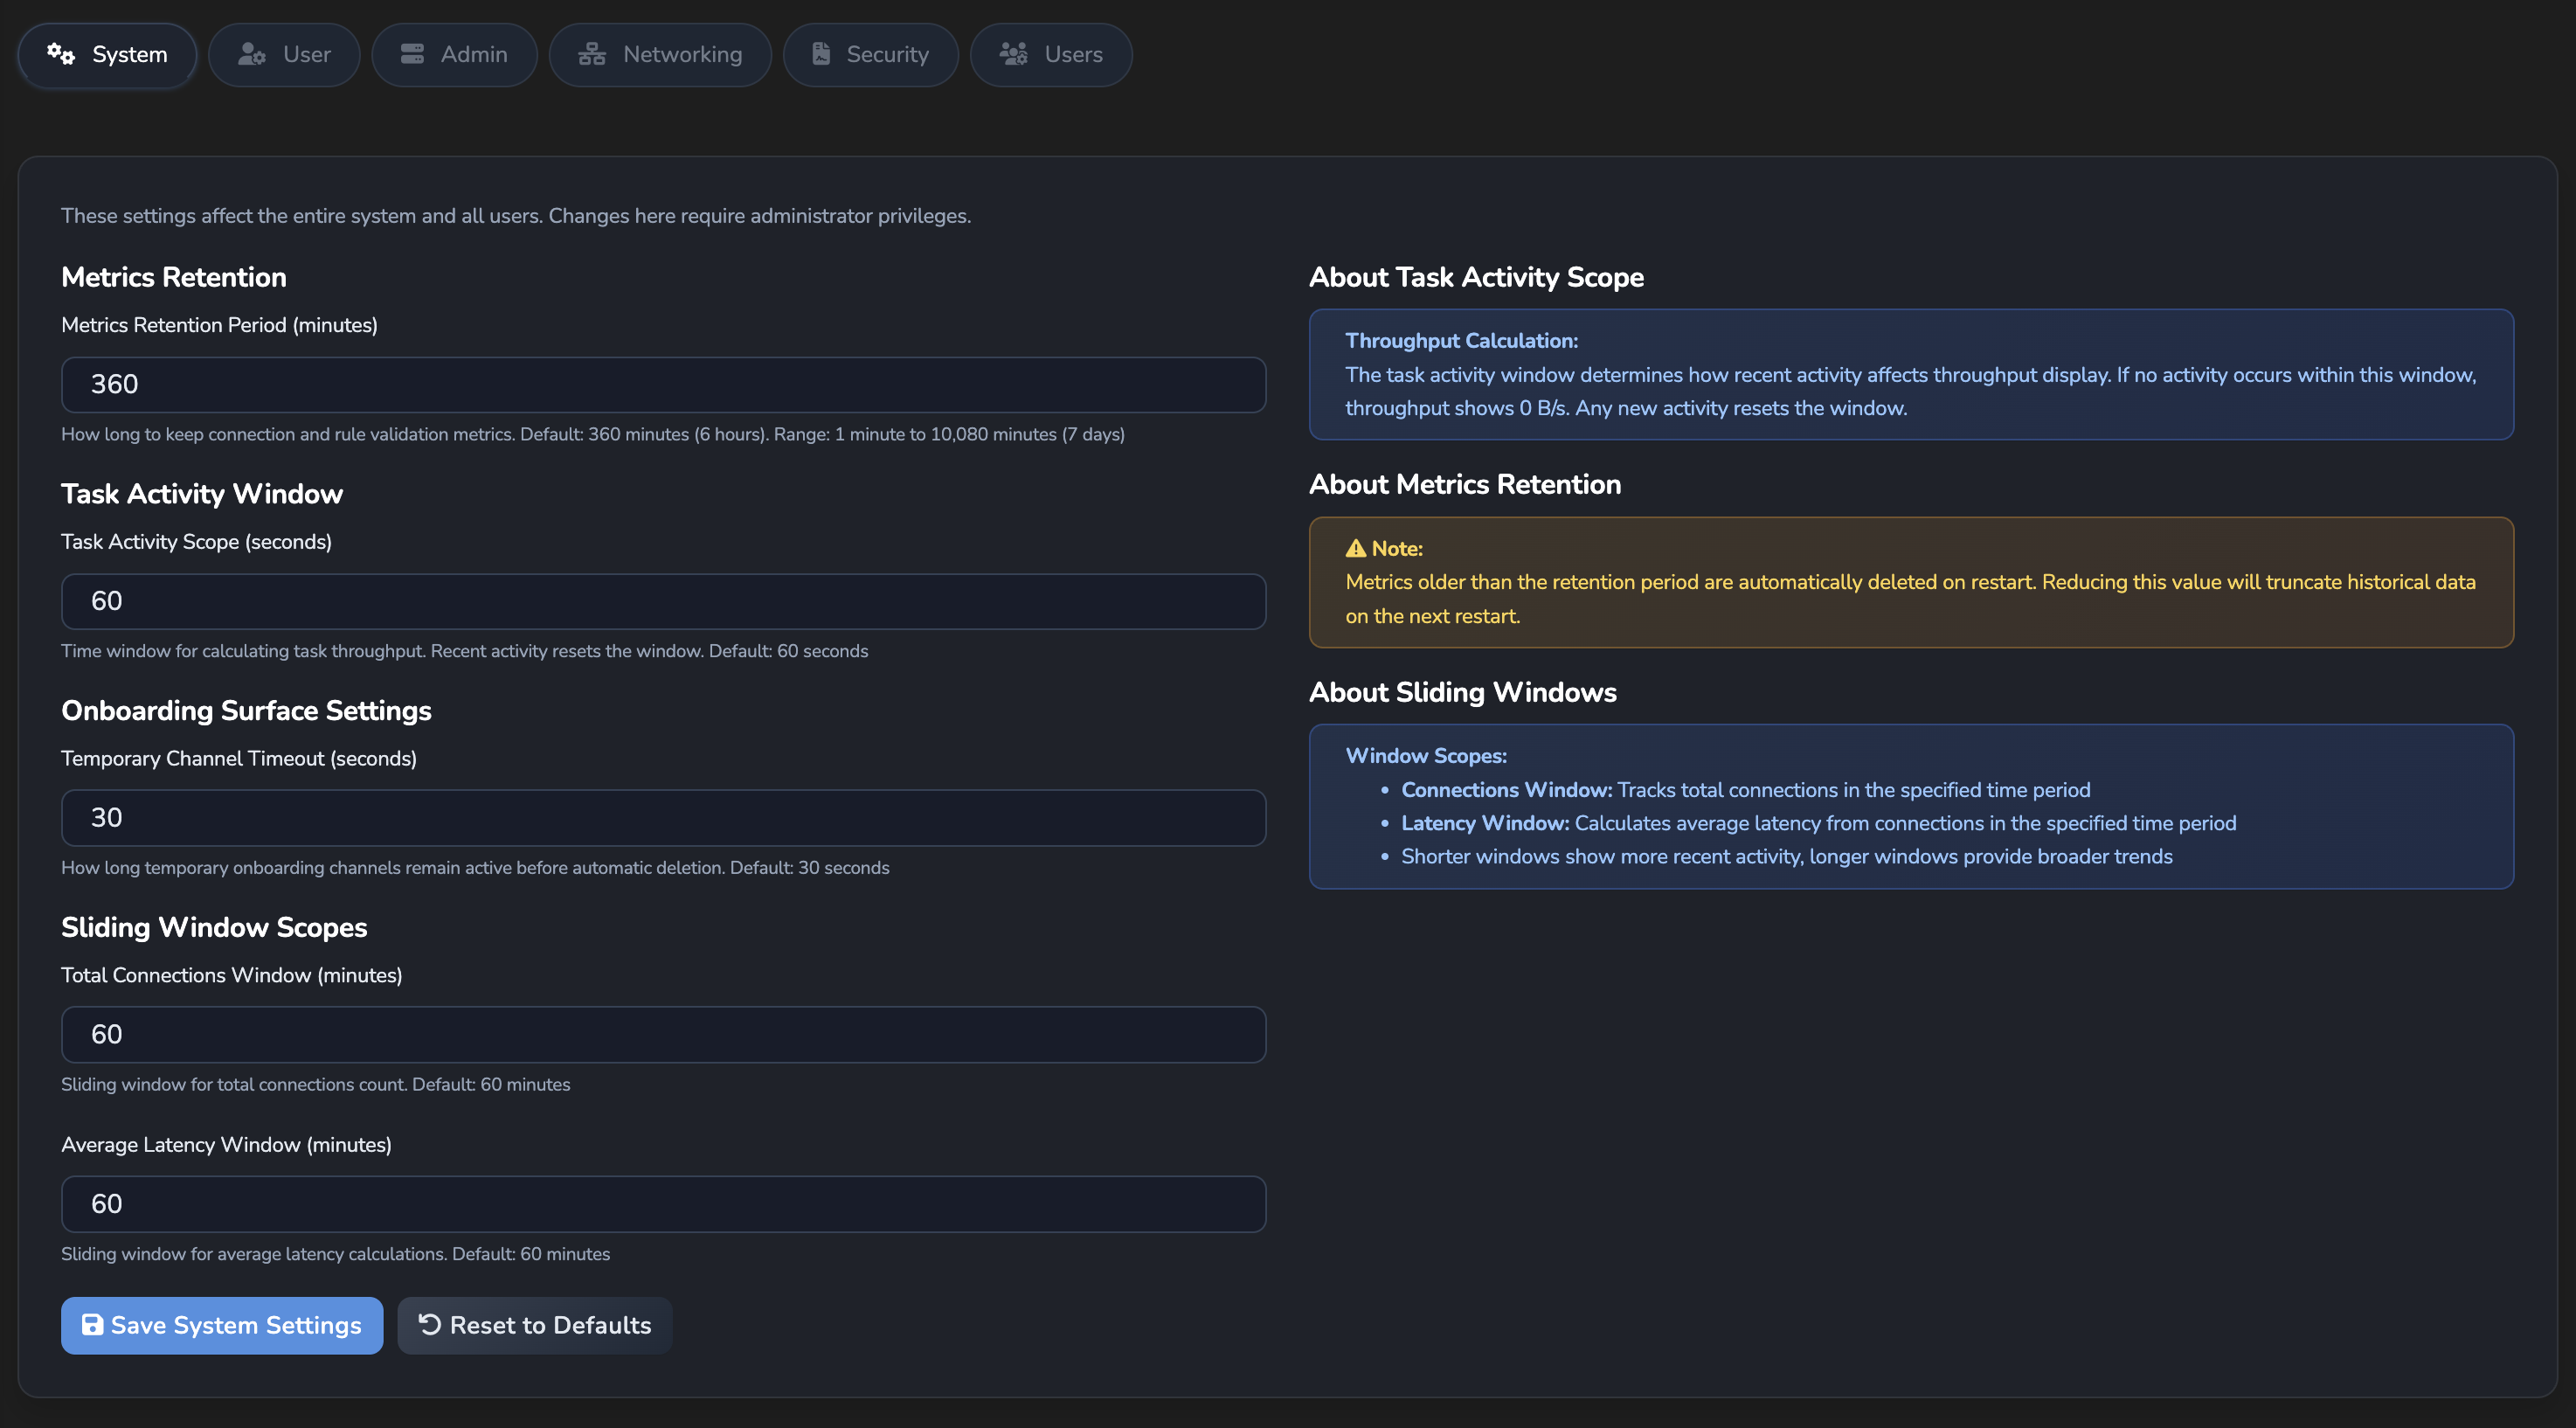
System tab
Applies to the entire gateway instance. Requires administrator role. Changes take effect immediately when saved.
Fields
| Setting | Type | Default | Range | Description |
|---|---|---|---|---|
| Metrics Retention Period | integer (minutes) | 360 | 1–10,080 | How long in-memory metrics data is retained. 360 retains 6 hours. Maximum is 10,080 minutes (7 days). Data outside this window is not available in charts or the dashboard. Reducing this value truncates historical data on the next restart. |
| Task Activity Scope | integer (seconds) | 60 | 10–600 | Time window used to calculate task throughput. If no activity occurs within this window, throughput shows 0 B/s. Any new activity resets the window. |
| Temporary Channel Timeout | integer (seconds) | 30 | 10–300 | Lifetime of temporary surfaces created during the onboard-from-payload wizard. The surface is automatically deleted after this period. |
| Total Connections Window | integer (minutes) | 60 | 1–1,440 | Sliding window used to count total connections on the dashboard and surface Monitoring tab. |
| Average Latency Window | integer (minutes) | 60 | 1–1,440 | Sliding window used to calculate average latency on charts. |
Actions
| Action | Description |
|---|---|
| Save System Settings | Applies all current system field values immediately. |
| Reset to Defaults | Reverts all system fields to their factory default values. |
User tab
Personal preferences saved to your user account. These override system defaults for your dashboard session only. Other users are not affected.
Fields
| Setting | Type | Default | Options / Range | Description |
|---|---|---|---|---|
| Badge time threshold | integer (minutes) | 5 | 1–1,440 | Identities created or used within this window are shown with a NEW or ACTIVE badge on the Identities page. |
| Auto-refresh interval | integer (seconds) | 5 | 1–300 | How often the dashboard polls for updated data. Lower values increase update frequency at the cost of higher bandwidth. |
| Log timestamp format | select | local | local, utc, relative, compact | Format for log entry timestamps. local: browser timezone. utc: ISO 8601. relative: for example, “2m ago”. compact: time portion only. |
| Time series bucket interval | select (seconds) | 30 | 30, 60, 300, 900, 1800, 3600, 10800, 21600 | Default bucket size for the aggregated connections time series graph. Can be overridden on the dashboard per session. |
| Minimum payment items to display | integer | 10 | 1–100 | How many payment items the Payments page displays. |
Actions
| Action | Description |
|---|---|
| Save My Preferences | Saves the current user preference values to your account. |
| Reset to System Defaults | Reverts your personal preferences to the system-wide values set by the administrator. |
Admin tab
System-level operations. Requires administrator role.
System actions
| Action | Description |
|---|---|
| Truncate Old Metrics Now | Immediately deletes metrics data older than the current retention period, without a restart. Returns a count of records removed and retained. |
| Truncate Old Logs | Removes accumulated log data. The current active log is always kept. |
Export storage
Produces a PII-redacted, encrypted snapshot of the storage directory.
| Field / action | Description |
|---|---|
| Ed25519 Public Key (PEM) | Paste the Ed25519 public key to encrypt the export. The export uses hybrid encryption (X25519 ECDH + AES-256-GCM). Only the holder of the matching private key can decrypt it. |
| Export & Download | Generates and downloads the export as a .atgx file. Sensitive directories (private keys, secrets, API keys, certificates, session tokens, credentials, avatars) are excluded entirely. |
Backup and restore
Full backup includes all data, including private keys, secrets, and credentials: everything required to fully restore the service. Backup files are encrypted with AES-256-GCM.
The backup archive contains sensitive data including private keys and credentials. Store it securely and never transmit it over unencrypted channels.
| Action | Description |
|---|---|
| Backup | Downloads an encrypted backup.tgwbak snapshot of all gateway data, including private keys, secrets, and credentials. Log data and system metrics are excluded; both are ephemeral and regenerate at runtime. |
| Restore | Uploads a backup.tgwbak file. The gateway automatically backs up the current data first, then restarts twice to complete the restore: once to begin replacing the data with the uploaded backup, and again once the restored data is in place and the gateway resumes normal operation. |
Prometheus authentication
Prometheus scrape authentication is not configured from this tab. It’s set on the Metrics page, under the OpenTelemetry tab, not here.
Feature flags
| Flag | Default | Description |
|---|---|---|
metrics | On | Shows the Metrics entry in the sidebar. Set to off to hide the sidebar entry; the /metrics routes remain reachable directly. |
agent_pay_delegation | Off | Reveals the Agent Pay (delegate payment) provider option in the Payment element of the surface builder. This only controls whether the option is offered when configuring a Payment element; surfaces already set up to delegate payment to a connected Agent-Pay gateway keep working and stay editable regardless of this setting. |
Changes to feature flags take effect immediately.
Networking tab
Shows the gateway’s inbound mTLS (mutual TLS) and client authentication configuration. Requires administrator role. These settings are read-only; they reflect the platform’s network configuration and cannot be changed from the dashboard.
| Setting | Description |
|---|---|
| Direct TLS client-cert request | Whether the gateway requests a client certificate during its own TLS handshake: Disabled, Optional (request, don't require), or Required (handshake fails without cert). |
| Trusted proxy CIDRs | IP ranges allowed to present a forwarded client certificate header. When empty, the forwarded-cert path is disabled. |
| Forwarded client-cert header | Name and format of the header read when the peer matches a trusted proxy CIDR. Format is either Envoy XFCC (x-forwarded-client-cert) or URL-encoded PEM (nginx ssl_client_escaped_cert). |
Security tab
Controls whether the gateway records Verifiable Presentation (VP) evidence of authorisation decisions for compliance auditing. Requires administrator role.
Fields
| Setting | Type | Default | Description |
|---|---|---|---|
| Enable VP Auditing | toggle | Off | When enabled, the gateway records VP evidence for every authorisation decision in the selected categories. |
When Enable VP Auditing is on, an Audit Categories section appears with the following checkboxes:
| Category | Description |
|---|---|
| Policy Decisions | Records OPA allow/deny outcomes for every policy evaluation. |
| Trust Checks | Records TRQP query outcomes for every trust-registry verification. |
| Identity Bindings | Records managed-identity VP injection events. |
Enable only the categories you need. Each additional category increases storage usage proportionally to request volume.
Actions
| Action | Description |
|---|---|
| Save | Applies the current audit toggle and category selections immediately. |
Limits tab
Visible to every signed-in user, with no permission requirement. Shows a read-only summary of the appliance-wide resource caps configured for this deployment, alongside how much of each is currently in use. Check it before provisioning a new secret, surface, policy, connection, integration, or proxy to see whether there is headroom left, or to understand why a create action was just blocked.
Fields
| Column | Shows |
|---|---|
| Limit | The resource dimension’s name, with a short description underneath of what it counts. |
| Usage | A progress bar showing current usage as a percentage of the cap. The bar turns amber at 80% of the cap and red once the cap is reached. |
| Current | How many of that resource exist right now. |
| Limit | The configured maximum for that resource. |
The table reuses the heading Limit for two different columns: the leftmost names the resource, the rightmost gives its numeric cap.
Some resources are capped both individually and as a group. A deployment might, for example, cap the total number of proxies while also capping how many of those may be MCP proxies or A2A proxies specifically. Creating a new proxy is blocked once either the group total or the specific type’s own cap is reached, whichever comes first. Where a resource has this kind of grouping, the table lists the group total and each of its sub-types as separate rows. The dashboard shows only the plain-language name for each row, but a row can be matched back to your own limits.json by its dot-notation key, for example proxies for the total and proxies.mcp for the MCP-specific cap.
If no limits are configured for this deployment, the tab shows “No resource limits are configured. All entity types are currently uncapped.” instead of a table.
When a limit is reached
Creating a new secret, surface, policy, connection, integration, or proxy is blocked once its resource cap is reached, whether that is the specific type’s own cap or the group total it belongs to. The create button shows a small “Limit reached” popup naming the resource and its current usage, and suggesting an appliance tier upgrade. This behaviour applies wherever a create action exists across the dashboard, not only when you have the Limits tab open.
Users tab
Visible to administrators only. Lists all gateway users with their username, role, status, and last login time. Users self-register from the login page using a passkey and appear here with New status until an administrator approves them. Provides edit and delete operations for existing accounts.
Roles
Agent Gateway enforces role-based access control with three roles. Roles are hierarchical: each role includes all capabilities of the roles below it.
Administrator
Full access to all permissions.
- System settings (view and edit)
- User management (create, approve, edit, and delete all accounts)
- Trust registry management
- Surface configuration and deletion
- API key and certificate management
- Integration configuration and gateway configuration reload
- Agent identity issuance
- Storage backup, restore, and export
- Secrets management (edit and delete)
- JWT Verification Strategies and STS Clients management
- Policy management
- Payment record edit and delete
- Audit log access
Another Administrator can downgrade or delete an Administrator account, with one exception: the only remaining approved Administrator account is protected, and its role and status cannot be changed and it cannot be deleted by any user.
Power User
Inherits all User access, plus:
- Mediator management (edit and delete)
- MCP proxy management (view, edit, and delete)
- A2A proxy management (view, edit, and delete)
- Surface payload capture
Power Users cannot access user management, system settings, trust registry or surface configuration, API keys, certificates, storage operations, or the audit log.
User
Read-only access to most shared gateway resources:
- View gateways, mediators, trust registries, surfaces, secrets, metrics, the dashboard, and logs
- View and retry payments
- Manage own notifications, issuers, and authorities
Users cannot manage user accounts, modify system settings, edit trust registries or surfaces, manage API keys, or perform storage operations.
User status
| Status | Description |
|---|---|
| New | Registered but not yet approved. The user cannot sign in until an administrator changes the status to Approved. |
| Approved | Active account. The user can sign in. |
| Disabled | Suspended account. The user cannot sign in. The account and its data are retained. |
Related
- Observability: How the dashboard home screen uses metrics retention and bucket size to display traffic data.
Glad to hear it! Please tell us how we can improve more.
Sorry to hear that. Please tell us how we can improve.
Thank you for sharing your feedback so we can improve your experience.