Observability
The Agent Gateway produces three telemetry signals on every request: distributed traces, metrics, and structured logs. Each signal carries agent identity context. A policy denial or a latency spike can therefore be attributed to a specific surface, identity, or routing decision rather than appearing as an undifferentiated failure. All three signals are exportable to any OTLP-compatible backend.
Two planes of observability
The gateway provides telemetry at two independent levels. You can use either without configuring the other.
| In-dashboard tools | External backends | |
|---|---|---|
| What it gives you | Live log stream, listener state, and real-time surface charts. | Durable storage, long-term trend analysis, cross-service correlation, and alerting. |
| Designed for | Diagnosis during active incidents. Confirming a configuration change took effect. | Compliance records, capacity planning, and post-incident analysis. |
| Examples | Logs page, Tasks page, Surface Monitoring tab. | Jaeger, Grafana Tempo, Datadog, New Relic, AWS CloudWatch, and any OTLP-compatible collector. |
Dashboard tools
| Tool | What question it answers |
|---|---|
| Dashboard | Is traffic flowing normally? Which surface is over-subscribed? |
| Logs | What did the gateway decide on a specific request? |
| Audit | Which policy decisions, trust checks, and credential delegation events occurred? |
| System | Is the gateway process under resource pressure? |
| Tasks | Is this surface actually listening? Why did a listener stop? |
| Metrics | Which surface has the most traffic or faults? |
| Capture | What changed between what the caller sent and what the backend received? |
Dashboard overview
The Dashboard home screen provides a real-time, gateway-wide snapshot of connection volume, latency, surface health, and agent identity activity. It refreshes automatically on a timer and is the natural starting point when opening the gateway.
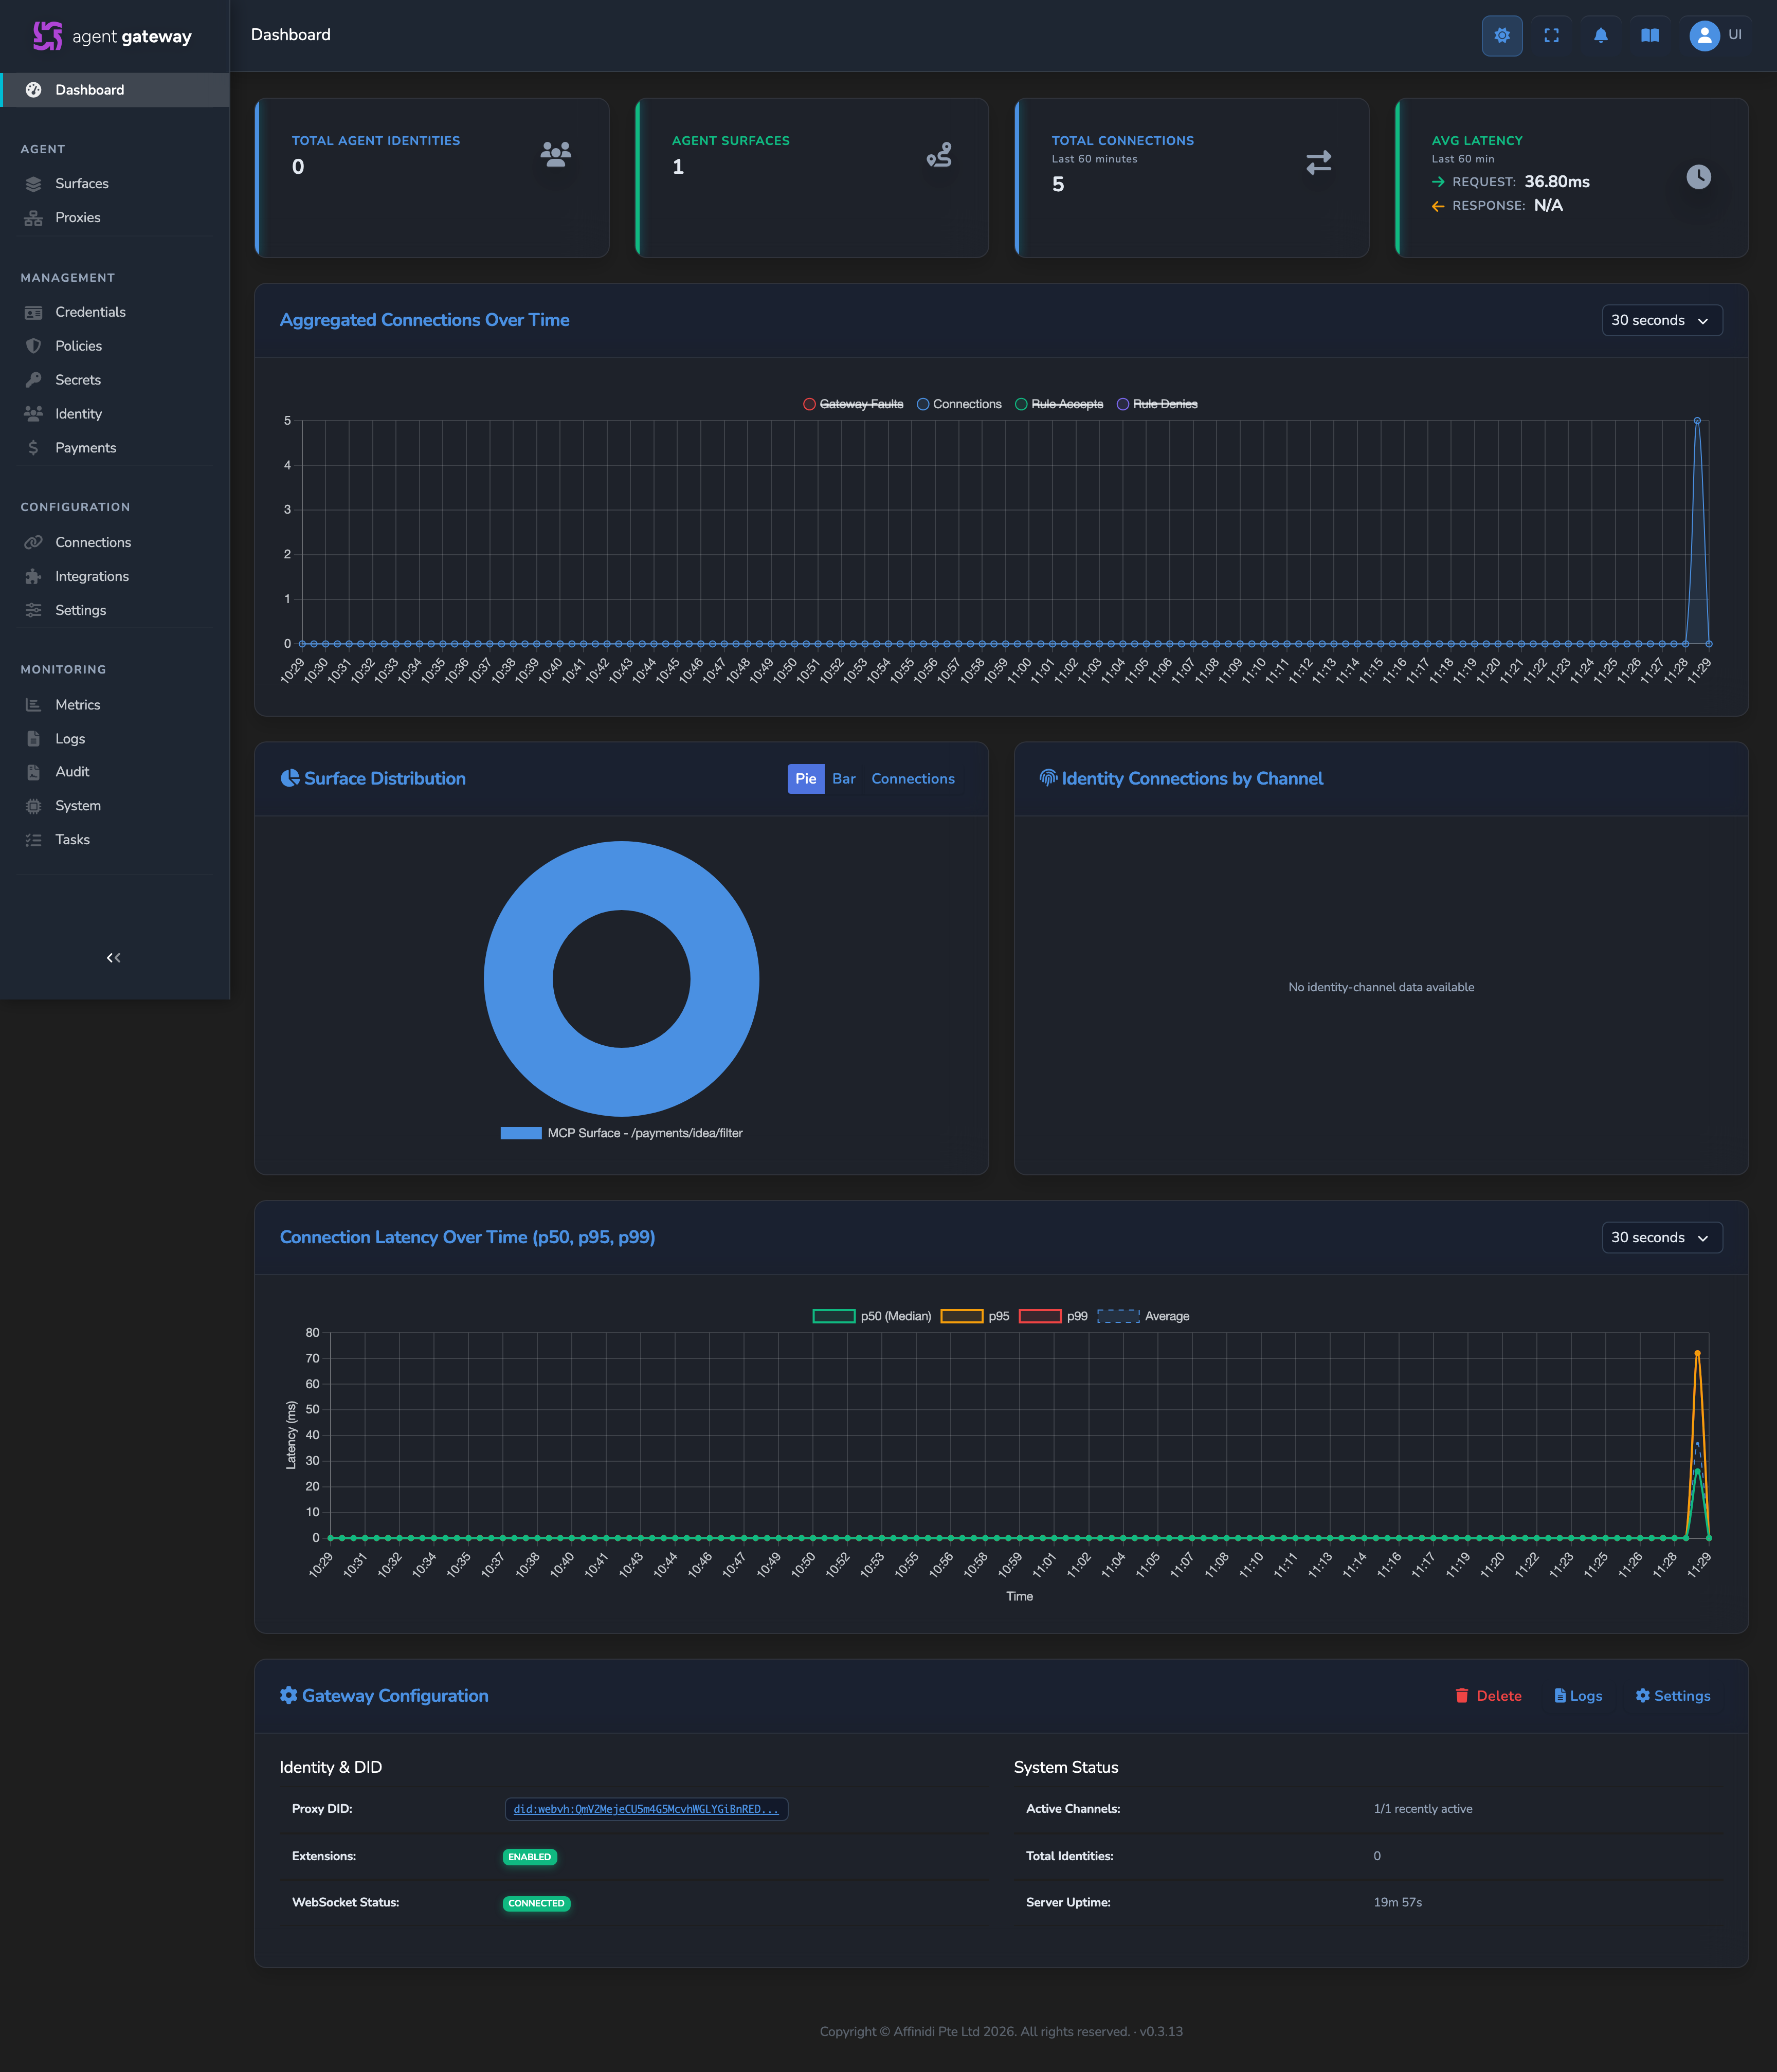
Four stat cards summarise current gateway activity. For field definitions, see Dashboard.
Below the stat cards, two time-series charts share a single bucket-size dropdown, from 30 seconds up to 6 hours:
- Aggregated connections over time: Request volume across the selected window. Changing the bucket-size dropdown redraws this chart and the latency chart below it at the new granularity; it does not filter the stat cards or the charts further down the page.
- Connection latency over time: End-to-end response times at the 50th, 95th, and 99th percentiles, plus an Average line, measured in milliseconds. A spike in the upper percentiles often signals load on a specific surface or external service even when the median remains stable.
Two further charts break traffic down by surface and by identity:
- Surface distribution: The busiest surfaces, ranked by accepted-connection volume or, before a surface has traffic, by its configured rule count. A toggle switches between a pie view, a bar view, and a connections view, and the chart shows up to the ten most active surfaces.
- Identity connections by channel: Each active agent identity’s connection outcomes, successful, denied, and gateway-fault, split out per surface.
Use the home screen to confirm that traffic is flowing normally, identify which surface is over-subscribed, and spot a sudden shift in one identity’s success/deny ratio before drilling into a specific surface or log stream.
Logs
The Logs page streams a unified, live output from all surfaces and gateway system components. Each entry carries a severity level, a timestamp, and the message text. The stream can be filtered without interrupting the live feed. Level chips let you select one or more severities at once, and Source chips narrow the stream to a single surface or gateway component. A one-click Problems preset selects every error and warning severity in a single step, and a clear-filters control resets every facet back to showing everything. A running count shows how many entries match the active facets against the total held in the buffer. A separate search box performs a find-in-page style text search over the visible entries, stepping through matches one at a time instead of filtering the underlying stream.
Use the Logs page when you need to understand what the gateway did on a specific request: which authentication outcome it produced, which policy decision it made, and which target it routed to. The sequence of log entries shows the order of decisions, which is often faster for diagnosis than numeric charts alone.
Audit log
The Audit page records policy decisions, trust checks, and credential delegation events as cryptographically attested Verifiable Presentation entries. Unlike the Logs page, audit entries are tamper-evident, persistent, and designed for compliance reporting and post-incident review rather than real-time diagnosis. Audit log →
System health
The System page shows CPU usage and memory consumption for both the gateway process and its host machine, alongside process uptime.
Use the System page when the gateway is slow or unstable and you need to separate an infrastructure problem from a configuration or policy one. Sustained memory growth or high process CPU often explains latency that appears in surface charts.
Runtime tasks
The Tasks page lists every active listener and worker: inbound surface listeners, outbound routes, MCP proxy listeners, and connection-point workers. Each row shows connection state, in-flight request count, cumulative error count, and last activity time.
Use the Tasks page to confirm that a configured surface is actually listening. A surface that is configured but not running appears with a failed or stopped connection state, showing its error count and last activity time so you can diagnose why.
Traffic and latency
The Metrics page shows a hierarchical view of request flow across all surfaces: source, caller identity, destination, request counts, acceptance and denial rates, and fault counts.
For per-surface detail, each surface has a Monitoring tab that shows time-series charts for request counts, rule accepts, rule denies, failures, gateway faults, and response latency at p50, p95, and p99.
Use the Metrics page to identify which surface is receiving the most traffic or producing the most faults. Use the surface Monitoring tab to investigate how a specific surface has behaved over a time window.
Request pipeline inspection
Each surface has a Capture feature, accessible from its Monitoring tab. Capture streams individual request payloads through each stage of the processing pipeline as they arrive. It is asynchronous and adds no latency to the request itself.
Four stages are visible per captured request:
- Inbound request: the payload as received from the source agent.
- Outbound request: the request forwarded to the backend, after identity injection and any gateway transformations.
- Inbound response: the raw response returned by the backend.
- Outbound response: the final response delivered to the caller.
Use Capture when a surface behaves unexpectedly and you need to see exactly what changed between what the caller sent and what the backend received. Comparing the inbound and outbound stages shows what identity fields the gateway injected, what metadata it added, and what the backend actually saw.
Connection tracking
Every request is recorded with the following fields:
| Field | Description |
|---|---|
| Timestamp | Precise time the request was received. |
| Surface identifier | Which surface processed the request. |
| Source address | The originating network address of the caller. |
| Destination | Where the request was routed (backend service, external gateway, and so on). |
| Status | Outcome classification: success, failed, or gateway_fault. Timeouts are recorded as gateway_fault. Policy denials are not recorded as a status value. They appear separately in the policy audit log entries. |
| Latency | End-to-end response time in milliseconds. |
| Trace ID | Unique identifier linking this request to its distributed trace and all related logs. |
| Direction | Whether this is an inbound request or outbound response. |
| Agent identity hash | Cryptographic fingerprint of the authenticated caller, enabling attribution across multiple requests. Only present when identity extraction is configured on the surface. |
This data feeds the dashboard charts and powers log correlation via the trace ID. To investigate a specific request outcome, find its trace ID in the Logs page, then cross-reference it with the corresponding distributed trace or audit log entry.
Multiple backend export targets
Metrics and traces can simultaneously persist to four independent targets, supporting diverse deployment patterns:
- Local files (JSON format): Used to populate the Agent Gateway’s in-dashboard views and provide immediate point-in-time visibility of gateway state.
- Prometheus/Grafana: For real-time dashboards, alerting rules, and metric-based SLOs in on-premises or hybrid environments.
- AWS CloudWatch: Direct integration for centralised logging and metrics in AWS environments. Other cloud logging services are reached indirectly through the OTLP collector integration below, not a direct integration of their own.
- OpenTelemetry (OTLP) collectors: Generic integration point supporting Jaeger, Grafana Tempo, Datadog, New Relic, Splunk, and any OTLP-compatible backend.
Real-time streaming
The gateway streams live updates to the dashboard over WebSocket, with no polling required. This enables:
- Live task monitoring: the Tasks page updates in real time as listeners start, stop, or transition between states.
- Live log streaming: new log entries appear immediately in the Logs page as they are produced, with no refresh required.
- Live metrics updates: dashboard charts and stat cards refresh automatically without manual page reload.
Structured logging
Every request gets a unique trace ID that links it across all telemetry signals:
- Injected into outbound requests as the
X-Gateway-Trace-Idheader. - Included in all gateway log entries for that request.
- Carried through the distributed trace in OTLP export.
This enables deterministic correlation: a single trace ID allows you to find all logs, metrics, and spans belonging to a single request across the gateway’s local logs, external log aggregators, and OTLP backends.
Exported telemetry signals
Distributed traces
The gateway creates a root span for every A2A and MCP request. Each span carries routing context, outcome status, latency, and agent identity context when identity is enabled.
The gateway propagates the W3C traceparent header, so gateway spans connect to the upstream caller’s trace and to any downstream service that also participates in distributed tracing. This produces a single end-to-end trace tree across the full request path, visible in Jaeger, Grafana Tempo, or another OTLP-compatible backend.
Metrics
The gateway records the following metrics. All are exported to every configured backend (Prometheus/Grafana, AWS CloudWatch, OTLP collectors, and local JSON files) and are also the source for the in-dashboard live views.
| Metric | In-dashboard location |
|---|---|
| Request counts per surface | Home screen Total Connections stat card (gateway-wide); Surface distribution chart (per surface); surface Monitoring tab |
| Request outcomes: accepted, denied, faulted | Home screen Aggregated connections over time chart; surface Monitoring tab |
| Response latency at p50, p95, and p99 | Home screen Connection latency over time chart; surface Monitoring tab |
| Policy allow and deny counts | Surface Monitoring tab (rule accepts / rule denies rows) |
| Error rate | Not a dedicated stat card. Derive it from the accepted/denied/fault counts on the Aggregated connections over time chart, or from a surface’s own Monitoring tab |
| Active connections (requests in flight) | Tasks page |
| Cumulative connection and error counts per listener | Tasks page |
Metrics export on a configurable interval and also feed the dashboard’s live views.
Structured logs
Every log entry carries a trace identifier that matches the corresponding OTLP span. This links a specific log entry to its trace in an external backend, so a request can be correlated across logs, traces, and metrics using a single identifier.
Log entries include request route, direction, status, policy outcome, and agent identity context when available. All exported signals carry resource attributes identifying the gateway instance: service name, binary version, and deployment environment. These ensure that signals from different gateway deployments remain distinguishable in a shared external backend.
Log examples
Every trust check query emits a structured log entry with the verification result and context:
WARN trust check: denied surface_id="1f4802ef-6734-4ffb-9003-42fc86e4b3ad"
     leg="caller" element_id="8008b0e2-1395-437a-9495-be105e7e2b83"
     element_name="" trust_registry_id="323ae2cb-cffc-4d81-8018-debcea3770e5"
     query_type="recognition" result="denied" ok=false latency_ms=101
The structured fields enable filtering and correlation:
| Field | Meaning |
|---|---|
| leg | Either caller (access point inbound) or target (managed application outbound). |
| element_id | Unique identifier of the trust check element that produced this result. |
| element_name | Optional operator-supplied label for the element (helpful for identifying which policy rule triggered). |
| trust_registry_id | The registry queried. |
| query_type | Either recognition (agent ownership / registration) or authorization (capability-based access). |
| ok | Boolean result; true allows, false triggers denial by default. |
| latency_ms | Round-trip time to the trust registry in milliseconds. |
When a trust check result flows to the policy engine, it appears in the OPA input as part of the context object:
"trust_check_results": {
  "caller": [
    {
      "id": "8008b0e2-1395-437a-9495-be105e7e2b83",
      "trust_registry_id": "323ae2cb-cffc-4d81-8018-debcea3770e5",
      "query_type": "recognition",
      "ok": true,
      "error": null,
      "authority_id": "did:web:authority.example.com",
      "entity_id": "did:web:caller.example.com",
      "action": "is",
      "resource": "ownedAgent",
      "query_resolved": true
    }
  ],
  "target": []
}
Your OPA rule can then branch on this result:
# Allow only if the caller passed trust verification
allow {
    input.trust_check_results.caller[_].ok == true
}
When a policy decision is made, a corresponding log entry records the outcome:
WARN policy decision: deny policy_scope="surface" policy_flow="access_point"
     policy_decision="deny" policy_id="surface.policy"
     deny_reason="Policy denied request" surface_id="1f4802ef-6734-4ffb-9003-42fc86e4b3ad"
     caller_did="did:webvh:QmTnW9VsBkDghqPSabm5mgKnw4mFd2QvTKPxtciMeE7P5i:..."
     trace_id="4dfcbc74-9697-4e21-9434-d1a5045cdf80"
Key policy decision fields:
| Field | Meaning |
|---|---|
| policy_scope | Where the policy was evaluated: gateway (inbound before routing) or surface (surface-level). |
| policy_decision | Either allow or deny. Denials always log at WARN level. |
| deny_reason | The custom denial message from your policy rule (for example, data.surface.policy.deny_reason). If the rule is absent, this falls back to a generic message. |
| caller_did | The resolved agent identity of the request source. Use this to debug identity resolution issues. |
| trace_id | Matches the corresponding distributed trace. Use this to correlate a log entry with its full trace in Jaeger, Tempo, or another OTLP backend. |
Correlating logs with traces
The trace_id field is the key to end-to-end debugging. When you see a denial in the logs, copy the trace_id and search for it in your OTLP backend:
- Gateway logs (stdout) show the decision and reason.
- Distributed trace (Jaeger, Tempo, Datadog) shows timing of each stage: authentication, trust check query, policy evaluation, and backend routing.
- Request capture (dashboard Capture tab) shows the exact payload transformations.
Together, these three views explain not just what happened, but why and how long it took.
Log redaction
Log redaction runs by default on every gateway instance. Before any output leaves the process, an ordered pipeline of rules matches sensitive patterns and replaces them with [REDACTED].
Redaction applies to:
- Formatted log lines written to stdout.
- Span attribute values exported via OTLP.
- The WebSocket log stream delivered to the dashboard.
Sensitive data is sanitised at source and never reaches an external log backend unredacted. The default rule set covers common credential patterns such as bearer tokens and API keys. Custom redaction rules are not configurable in the current deployment model.
Sampling
The OTLP trace exporter supports a configurable sampling rate between 0.0 and 1.0. At 1.0, every request produces a trace span. At lower rates such as 0.1 for 10%, export volume is reduced while statistically representative traces are retained. Reducing the sampling rate is typical for high-throughput production deployments.
Metrics and logs are not sampled. Every request produces a metrics data point and a log entry regardless of the trace sampling setting.
Event notifications
Event notifications deliver push alerts to an external destination when gateway lifecycle events occur: a user is approved, a gateway is created, or a connection point changes state. Unlike telemetry signals, they fire on configuration and lifecycle changes, not on individual requests.
An event notification combines a delivery channel (email, Slack, a webhook endpoint, or a streaming platform), an event category that determines which events trigger it, and a message template populated with event-specific data at delivery time. When a matching event occurs, the gateway renders the template and delivers the message. Notifications are push-only and retried on failure, so a transient outage at the destination does not drop a notification.
Use event notifications when gateway activity needs to reach people or systems outside the dashboard. Use the dashboard tools for real-time request-level diagnosis. The two are independent and can be used together.
Configure an event notification →
Related
- Set up event notifications: Configure push alerts for gateway events.
- Metrics reference: Field-level reference for emitted metrics records.
- Surfaces: Understand where Capture sits in Agent Surface processing.
Glad to hear it! Please tell us how we can improve more.
Sorry to hear that. Please tell us how we can improve.
Thank you for sharing your feedback so we can improve your experience.