Dashboard
Production gateway deployments generate continuous traffic across multiple surfaces. Without a central view, identifying which surface produced an error spike or which agent identity is driving high latency requires querying logs directly. The dashboard provides a real-time, gateway-wide view of connections, latency, surface health, and agent identity activity, with a shared time-window control for its two time-series charts and quick links into the Identities and Surfaces views.
What the dashboard shows
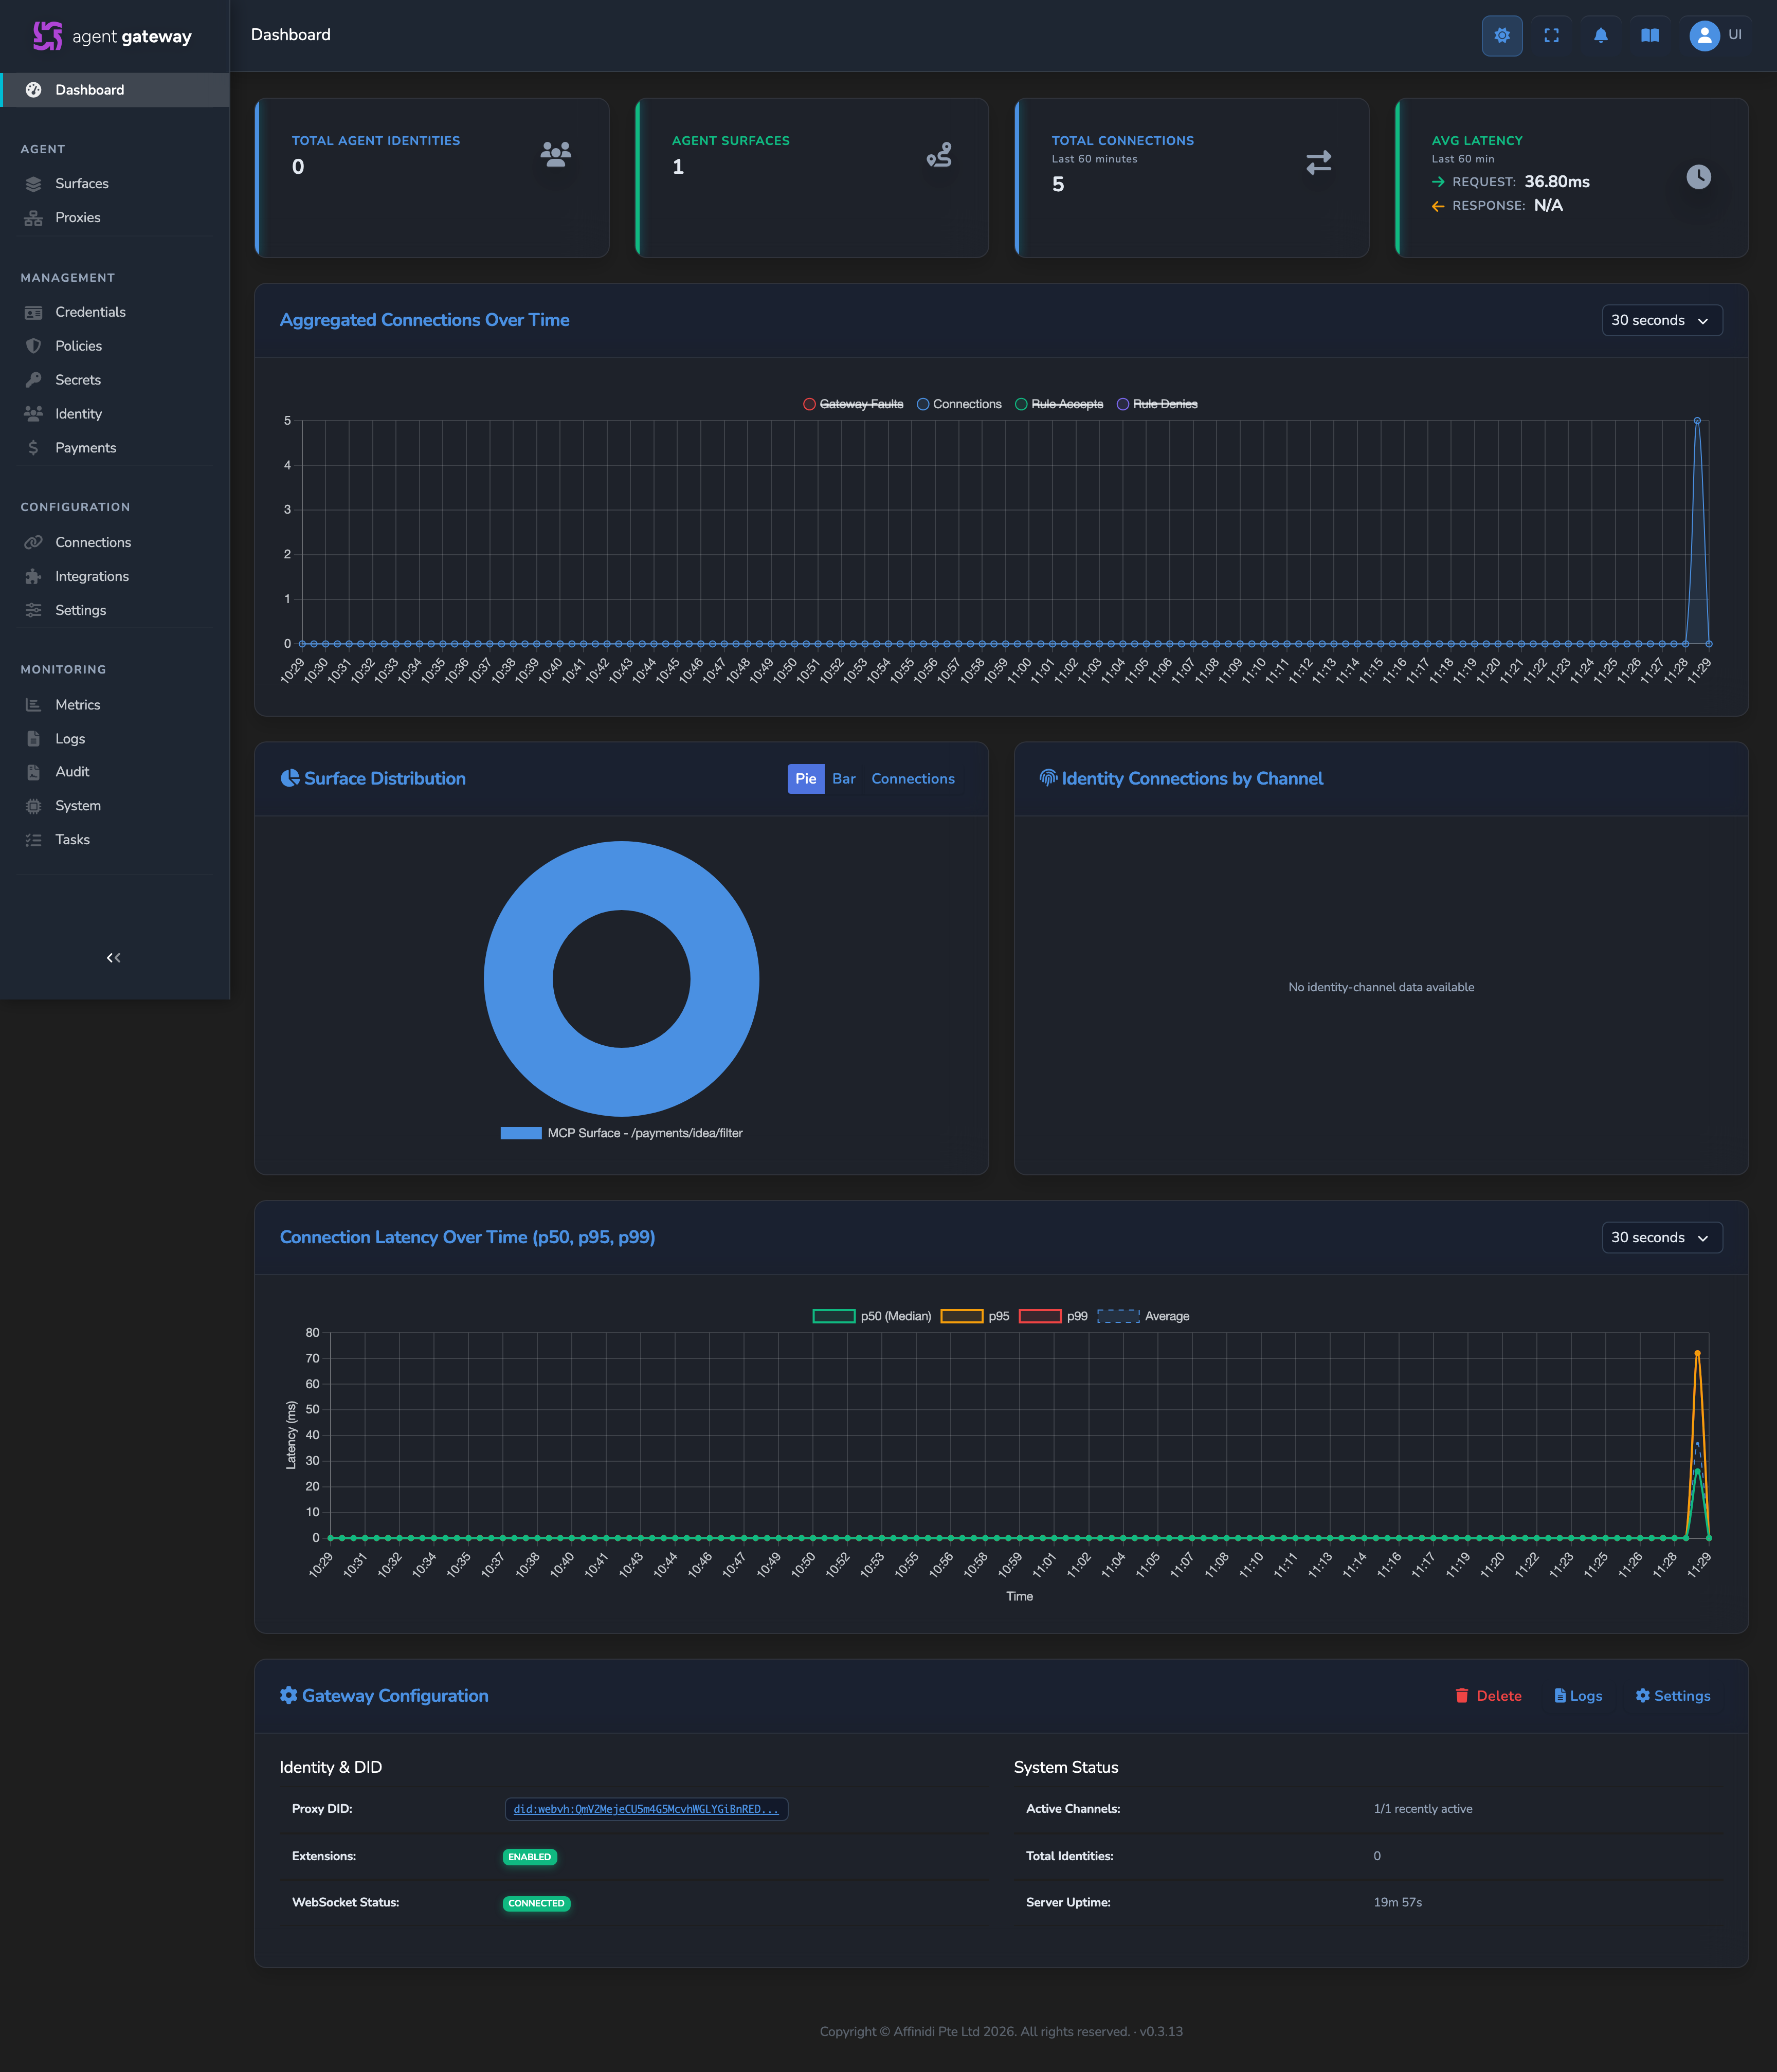
The dashboard loads automatically when you log in, and is organised into the stat cards row and the four charts below it.
Stat cards
Four cards across the top of the page summarise current gateway activity:
| Card | What it measures | Selecting it |
|---|---|---|
| Total Agent Identities | Count of distinct agent identities the gateway has resolved. | Opens the Agent Identities view. |
| Agent Surfaces | Count of configured surfaces. Carries a FAULT badge when one or more surfaces currently show a fault status. | Opens the Surfaces list. |
| Total Connections | All requests processed in the current metrics window. | Opens Settings, where the metrics window is configured. |
| Avg Latency | Average request and response latency over the current metrics window, shown as separate request and response figures. | Opens Settings. |
The values update automatically according to the refresh interval configured in settings.
Aggregated connections over time
A line chart showing request volume over time. A dropdown above the chart sets the bucket size, from 30 seconds up to 6 hours, and applies to both this chart and the Connection latency over time chart below it. There is no click-to-filter interaction on the chart itself: changing the dropdown redraws both time-series charts at the new granularity, it does not filter the stat cards or the charts further down the page.
Connection latency over time
A line chart showing end-to-end request latency at the 50th, 95th, and 99th percentiles, plus an Average line, using the same bucket-size dropdown as the connections chart above it.
Surface distribution
A chart showing the busiest surfaces, ranked by accepted-connection volume, or by configured rule count when a surface has not yet received traffic. Toggle buttons above the chart switch between a pie view, a bar view, and a connections view. Up to the ten most active surfaces are shown.
Identity connections by channel
A bar chart breaking down each active agent identity’s connection outcomes, successful, denied, and gateway-fault, split out per surface. Use this to see whether a specific identity’s traffic problems are isolated to one surface or spread across several.
Gateway Configuration panel
Below the charts, a Gateway Configuration panel shows this instance’s Proxy DID (with a link to view the full DID document), whether protocol extensions are enabled, WebSocket connection status, the number of active channels, the total identity count, and server uptime. It also carries shortcuts to the Logs and Settings pages, and a Clear all stored metrics data action for resetting the dashboard’s local metrics store.
Related views
The dashboard is a gateway-wide summary. For per-surface detail, open that surface from the Surfaces list and use its own Monitoring tab, which shows the same connection and latency charts scoped to that single surface, alongside a live log stream.
The Agent Identities view, accessible from the sidebar’s Identity item or the Total Agent Identities stat card, shows the complete list of all known agent DIDs across all surfaces.
Related
- Surfaces: How surfaces define and manage agent interaction flows and generate the data the dashboard displays.
- Agent identity and DIDs: How the gateway assigns a DID to each unique agent configuration.
- Observability: How the gateway produces metrics and traces that feed the dashboard.
Glad to hear it! Please tell us how we can improve more.
Sorry to hear that. Please tell us how we can improve.
Thank you for sharing your feedback so we can improve your experience.