Metrics
Affinidi Portal shows each service’s metrics on that service’s page, so you can track sign-ins, credential issuance, data sharing, and verification for your active project. Appliance products, such as Verifiable Trust Agent and DIDComm Mediator, also show health, traffic, and resource use on each configuration’s page.
Switch a graph between Daily and Monthly to change the period it covers. Service graphs also show when their data was last updated.
Affinidi Login
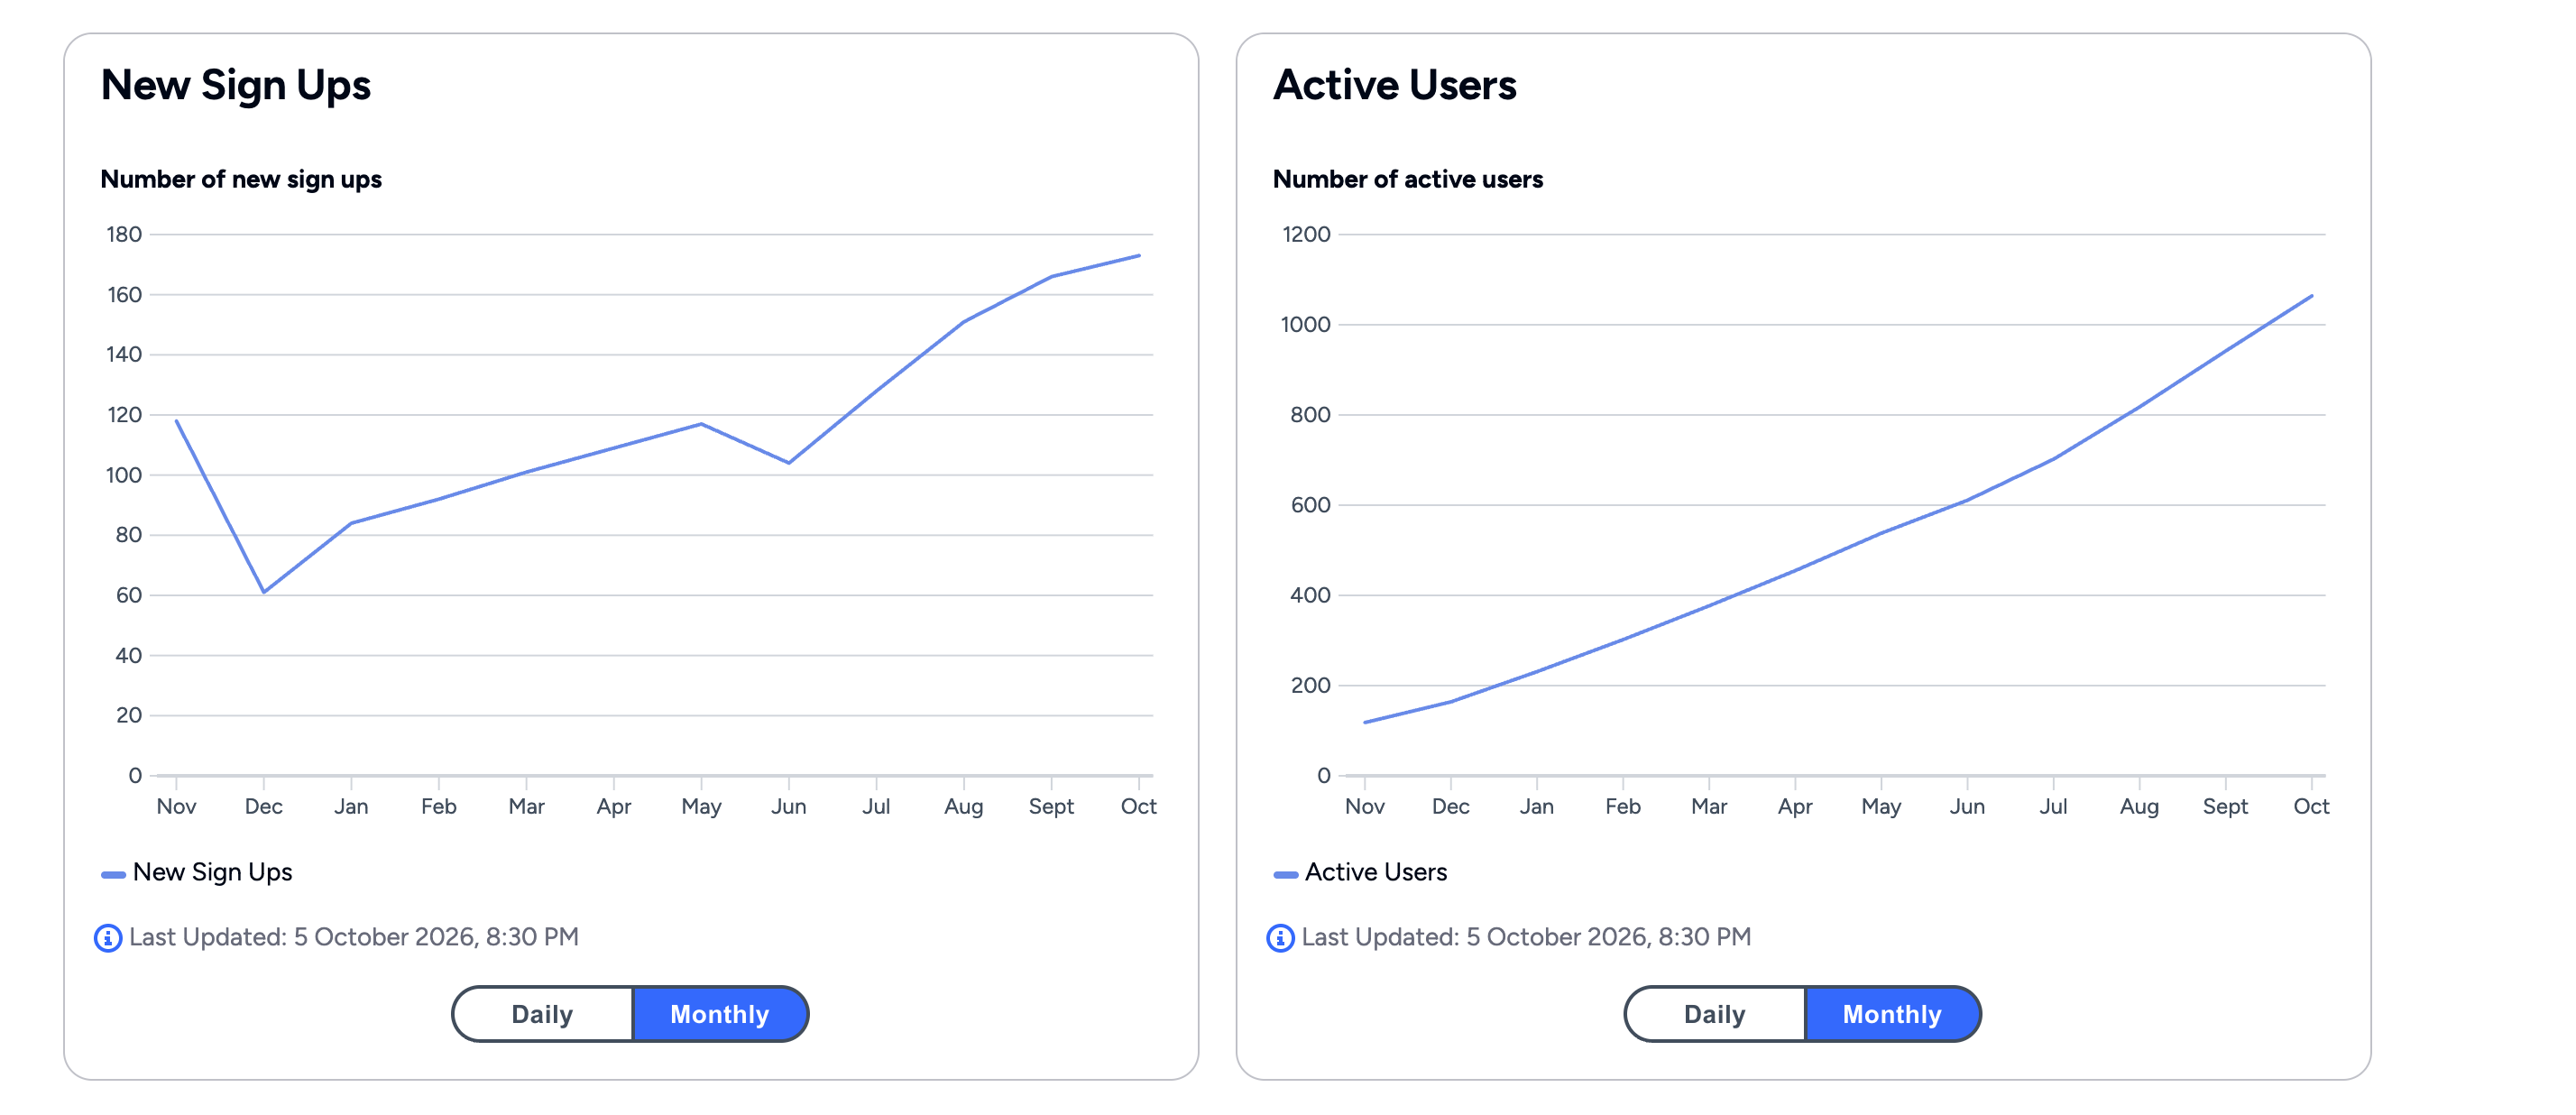
The Affinidi Login page shows two graphs:
- New Sign Ups: the number of users who signed in to your application with Affinidi Login for the first time.
- Active Users: the number of unique users who signed in to your application with Affinidi Login.
The project page also shows the current month’s figure as Current month active users. See Project page.
Credential Issuance
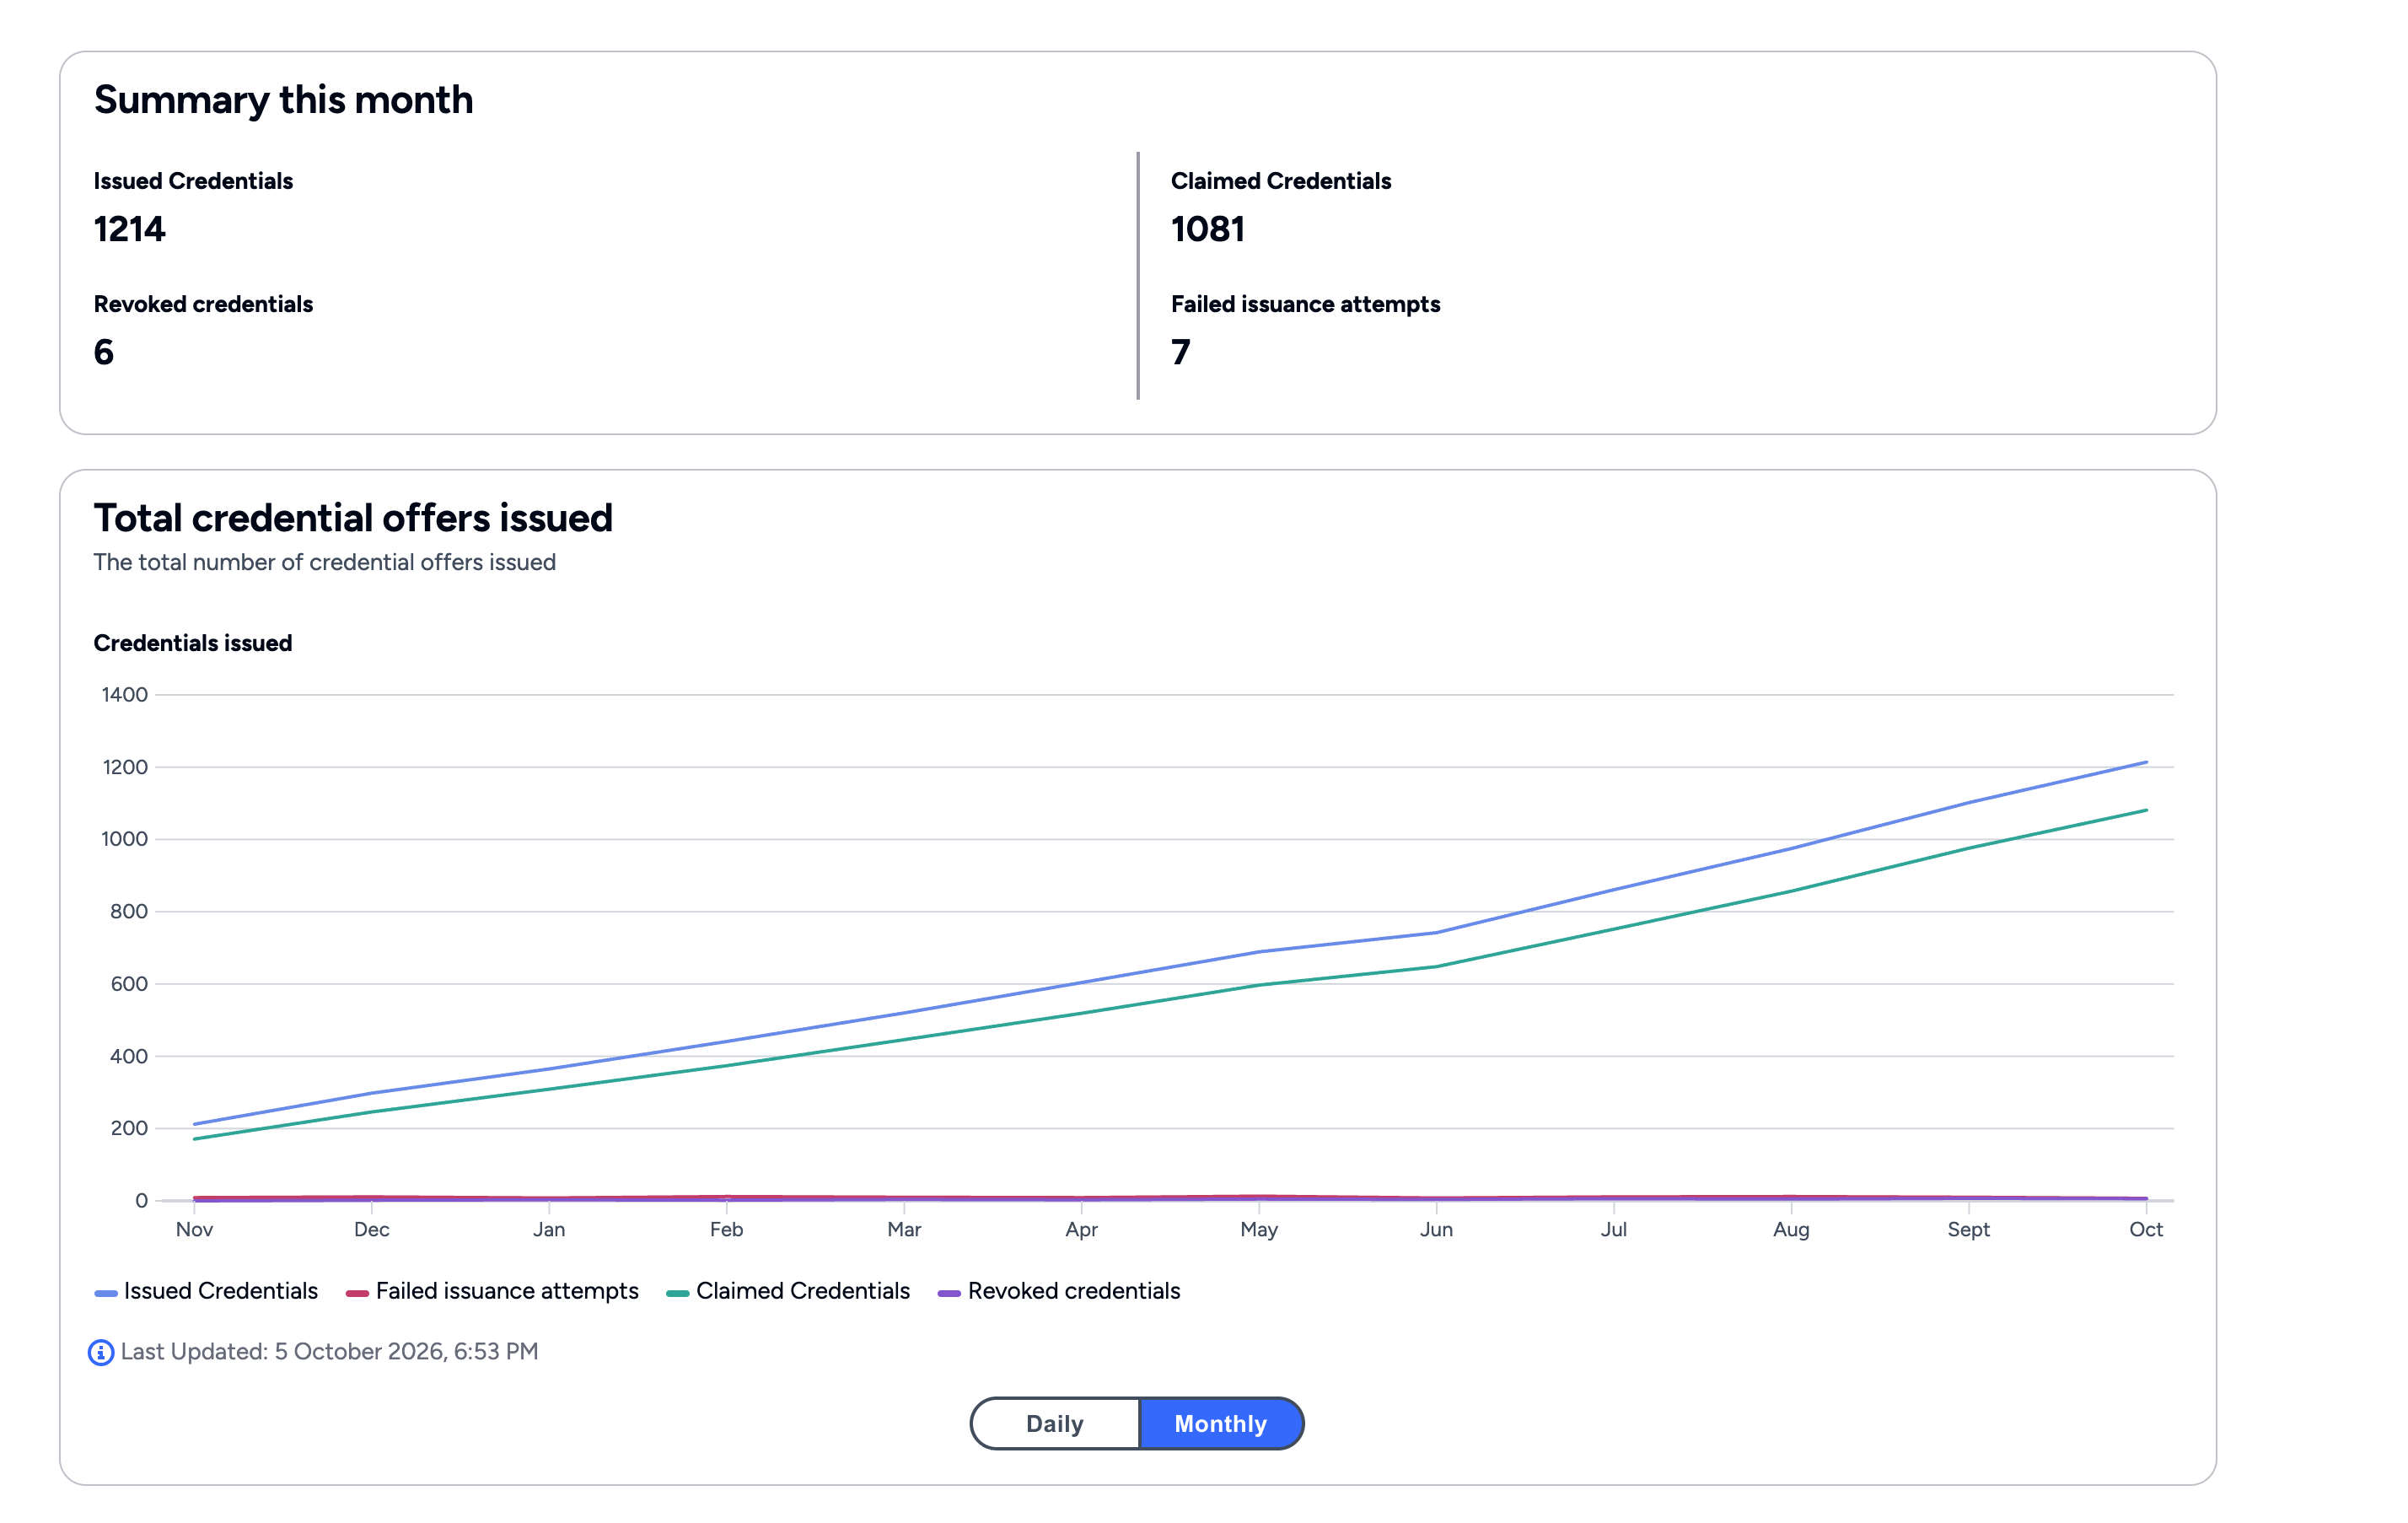
After you create your first issuance configuration, the Credential Issuance page shows its metrics.
The Summary this month section shows:
- Issued Credentials
- Claimed Credentials
- Failed issuance attempts
- Revoked credentials
The Total credential offers issued graph shows the same four metrics over time.
Affinidi Iota Framework
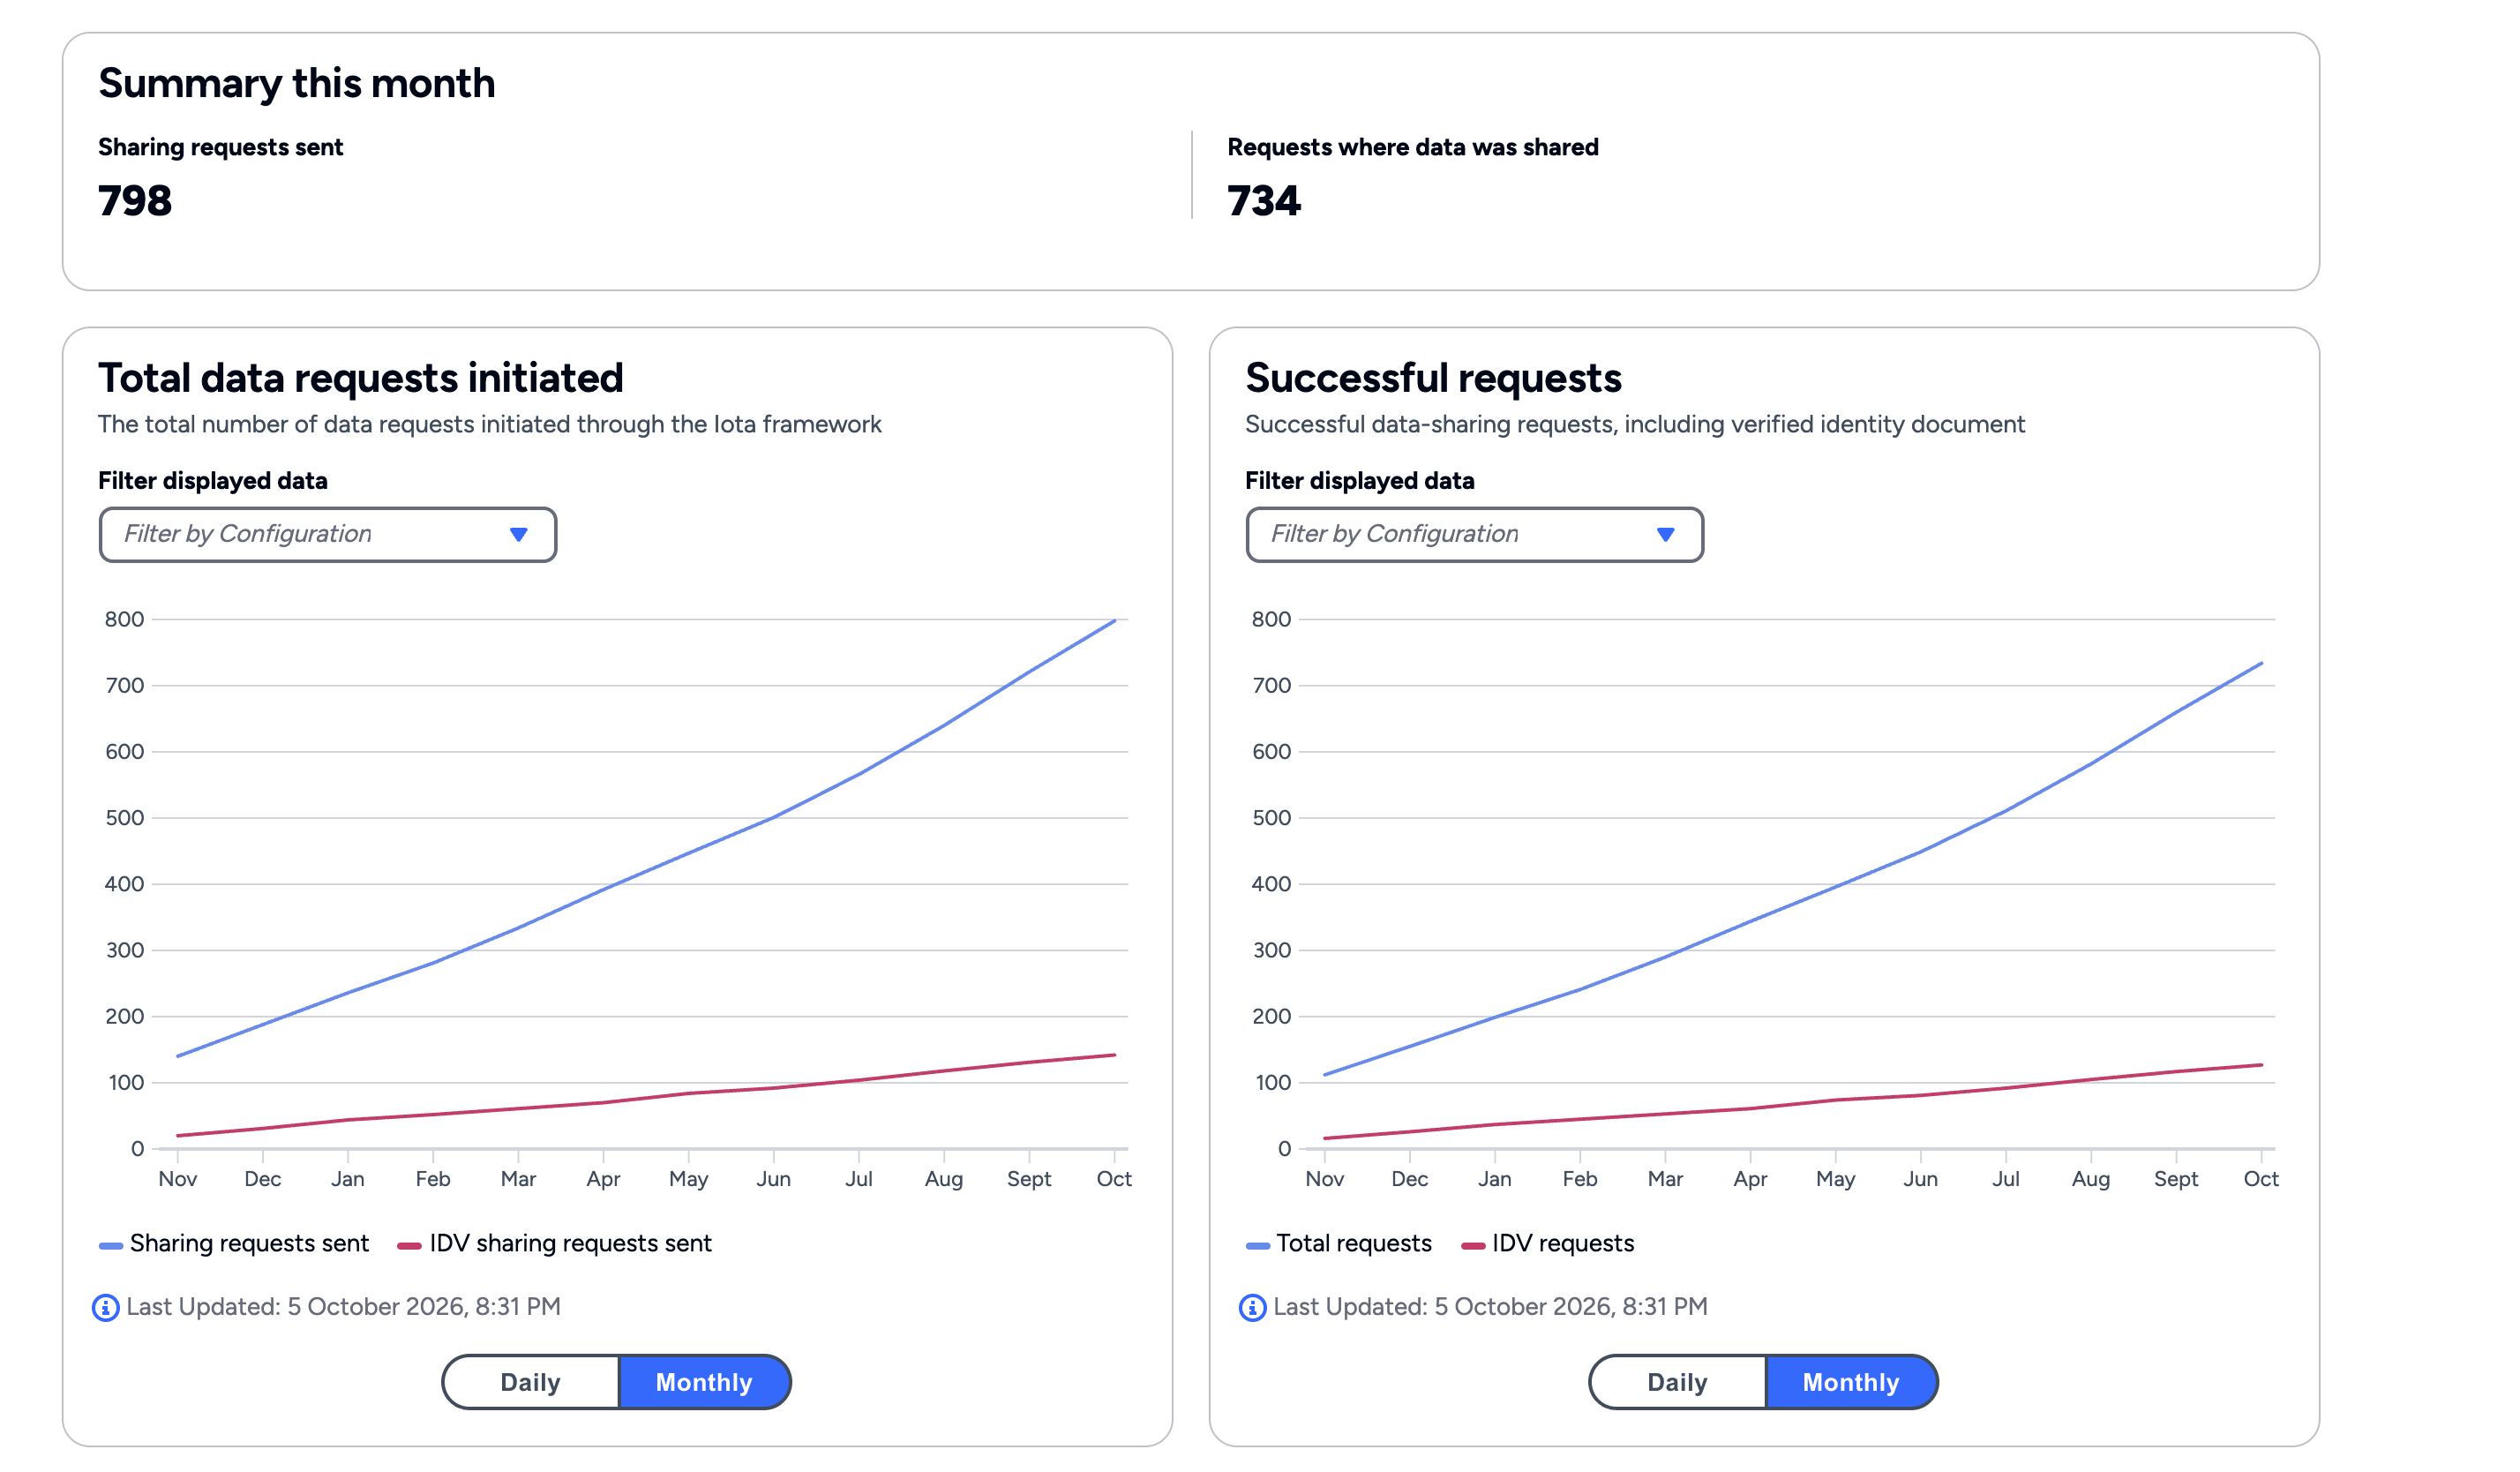
After you create your first Iota Framework configuration, the Affinidi Iota Framework page shows its metrics.
The Summary this month section shows:
- Sharing requests sent: the data requests your application sent to users.
- Requests where data was shared: the requests users completed by sharing the requested data.
Two graphs show the same activity over time: Total data requests initiated and Successful requests. A configuration’s own page shows these graphs for that configuration.
Identity verification
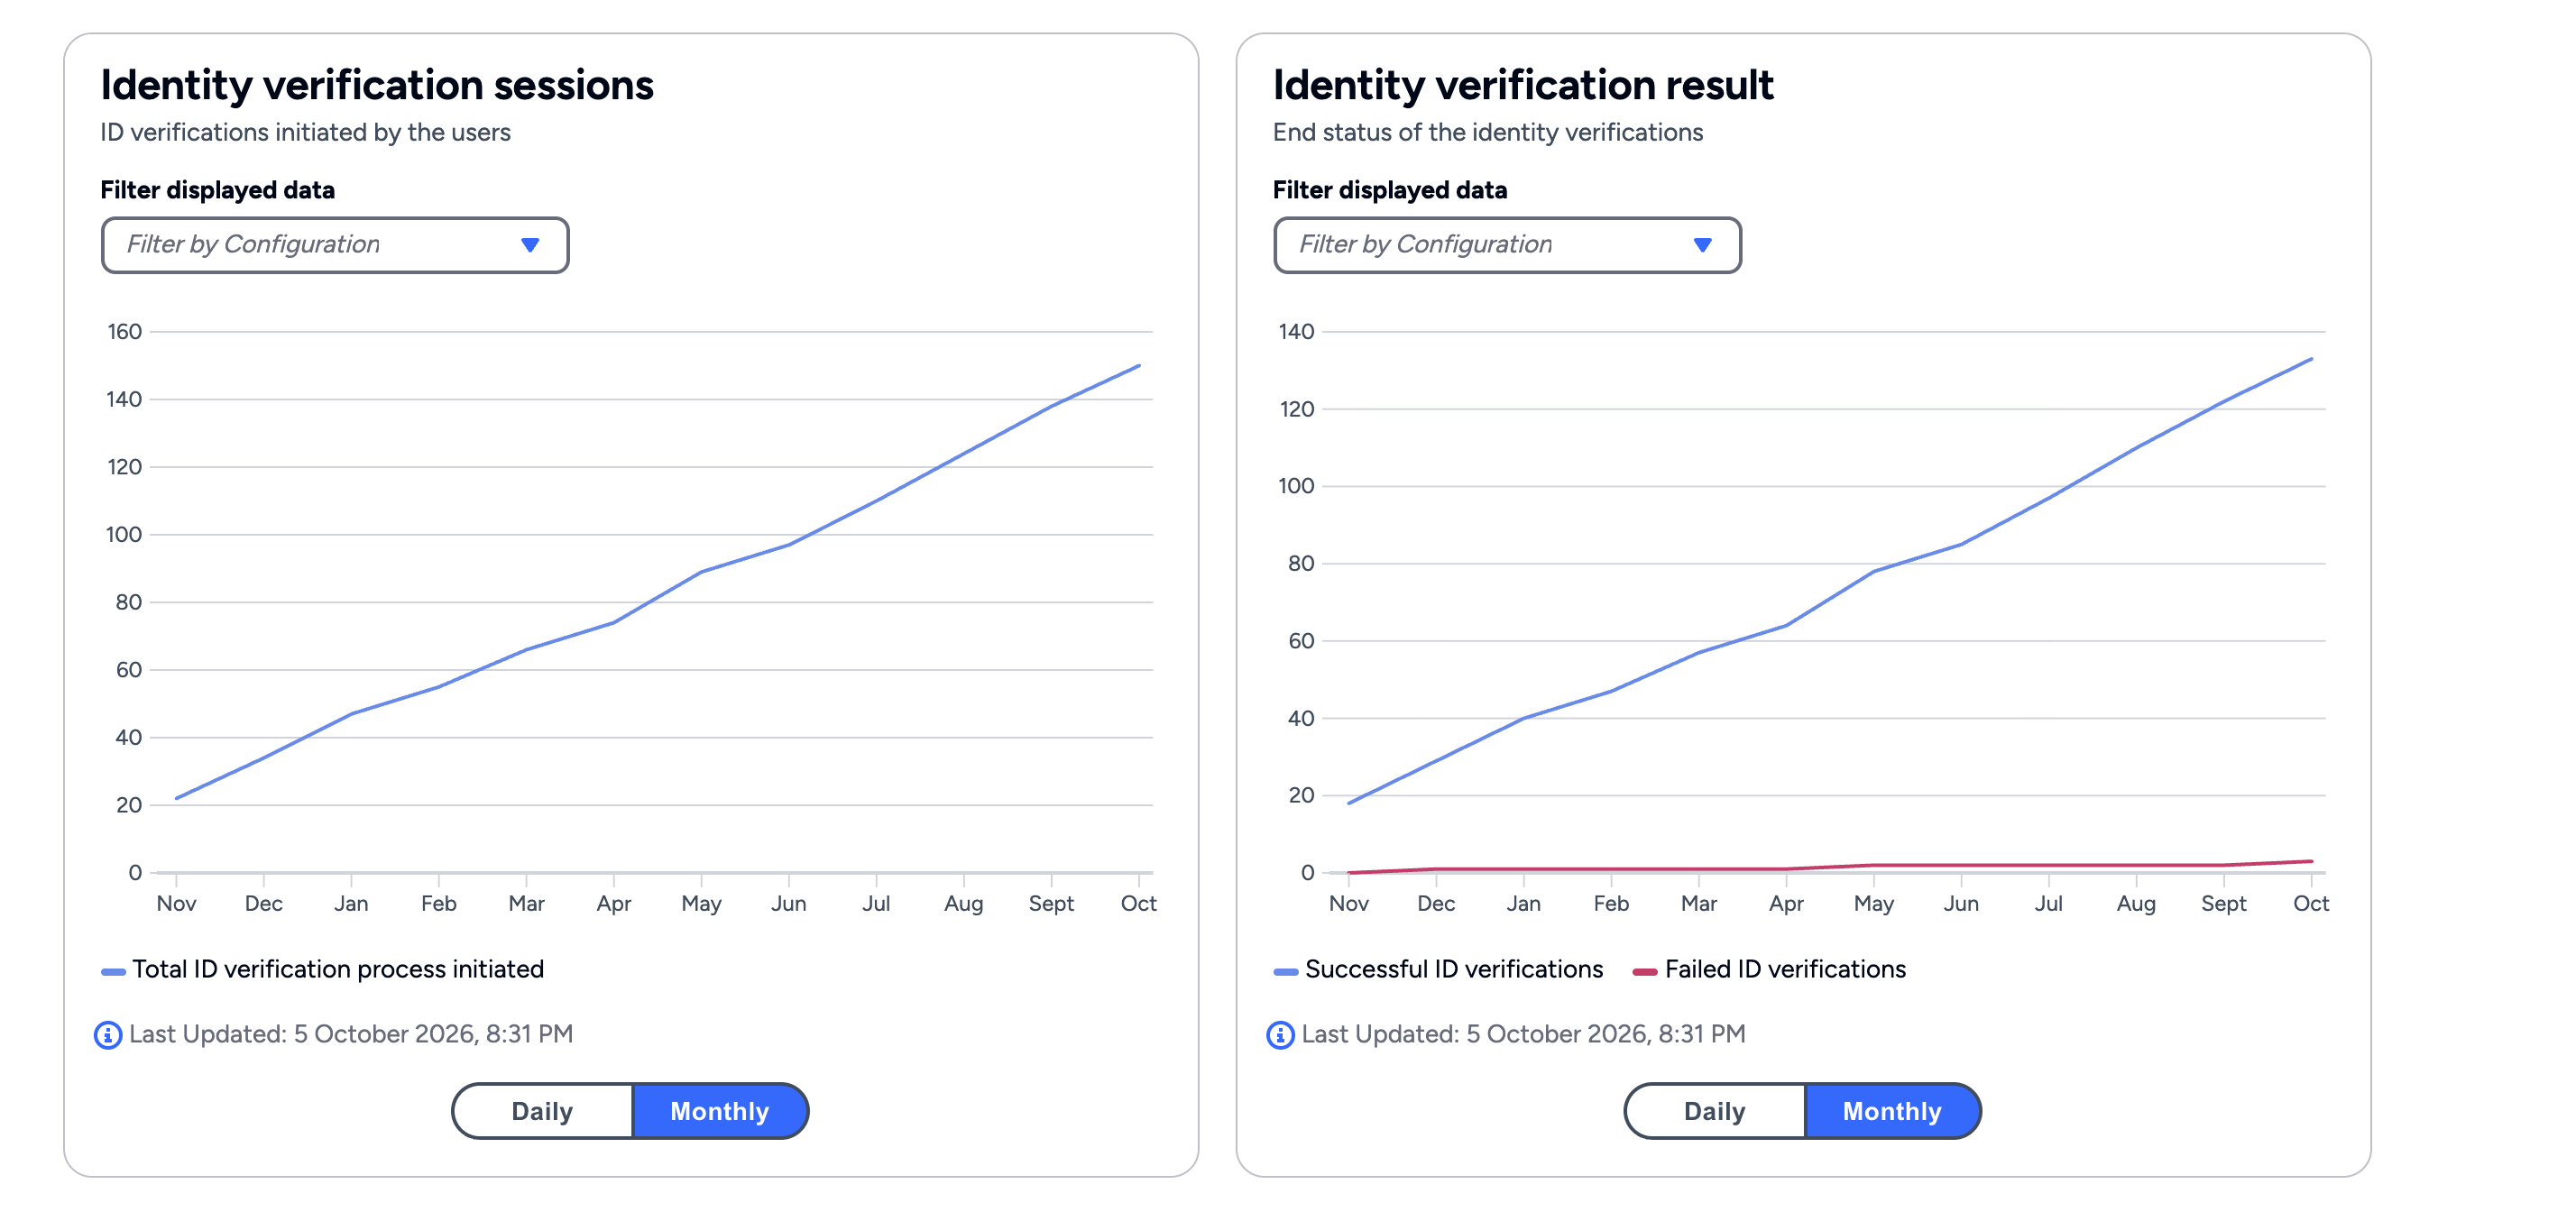
On projects with identity verification enabled, the Iota Framework graphs also include Identity verification sessions and Identity verification result. These track the identity verifications users start and complete with a government identity document in Affinidi Vault.
Credential Verification
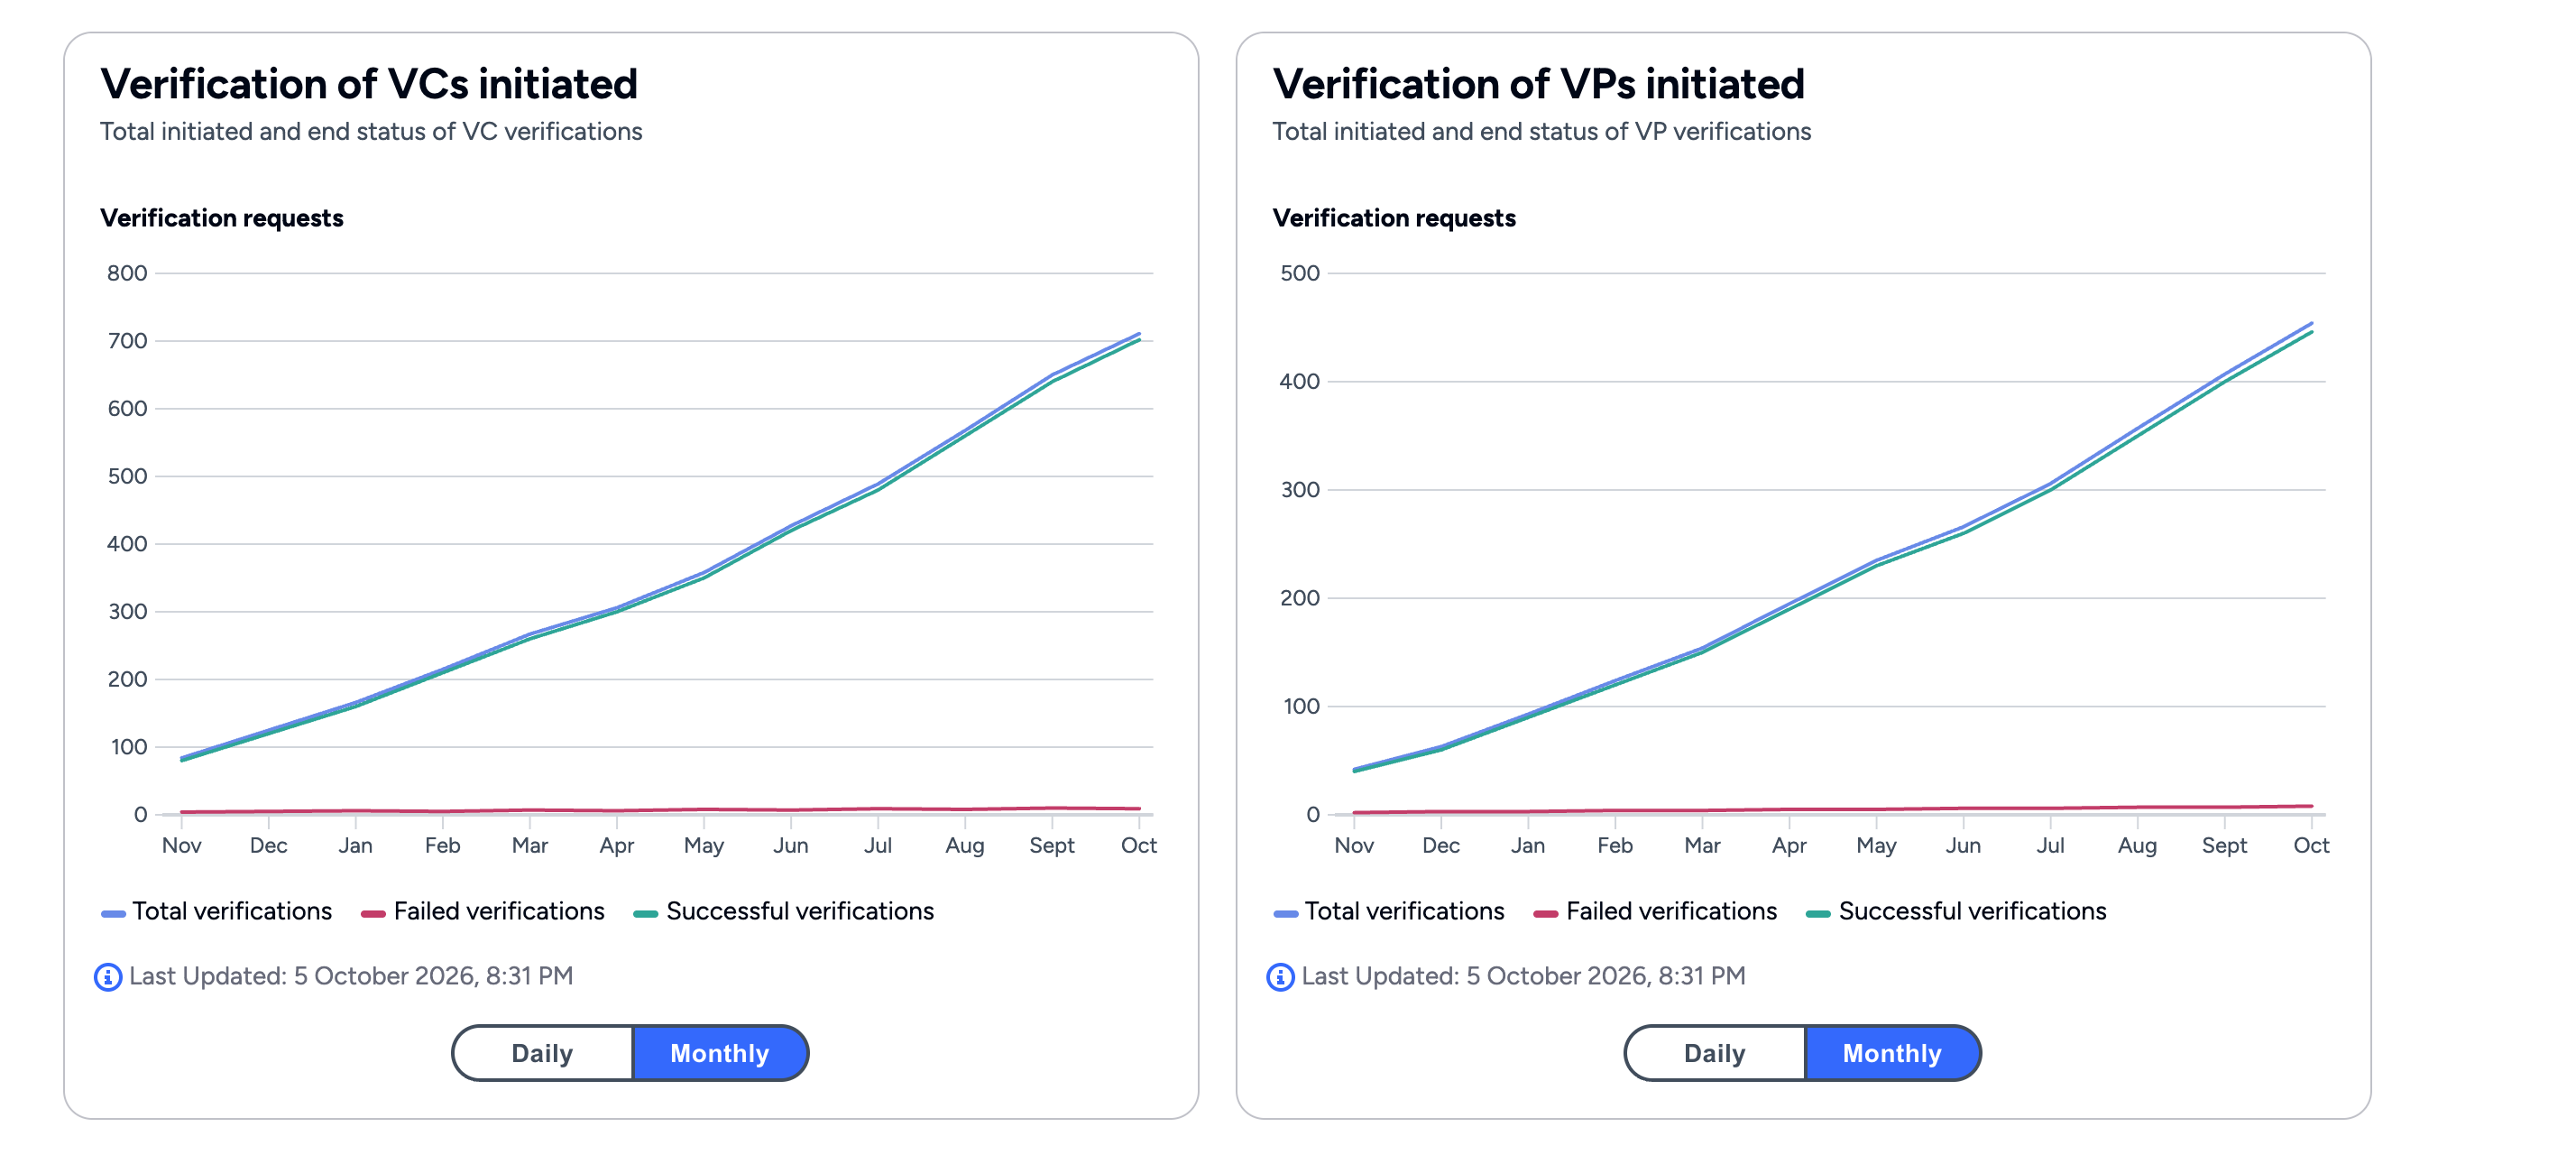
The Credential Verification page shows two graphs:
- Verification of VCs initiated: the verifiable credential (VC) verifications your application started, and their end status.
- Verification of VPs initiated: the verifiable presentation (VP) verifications your application started, and their end status.
Verifiable Trust Agent
A Verifiable Trust Agent (VTA) configuration’s page shows its metrics once the VTA is deployed. If no metrics are available for the VTA yet, the page shows Metrics not available yet, and the metrics appear after the VTA’s next update.
The metrics are grouped into three tabs:
- Health: Availability, the share of health checks that passed this month, and Current status, Up or Down. The Up / Down graph shows the result of the VTA’s health check over time.
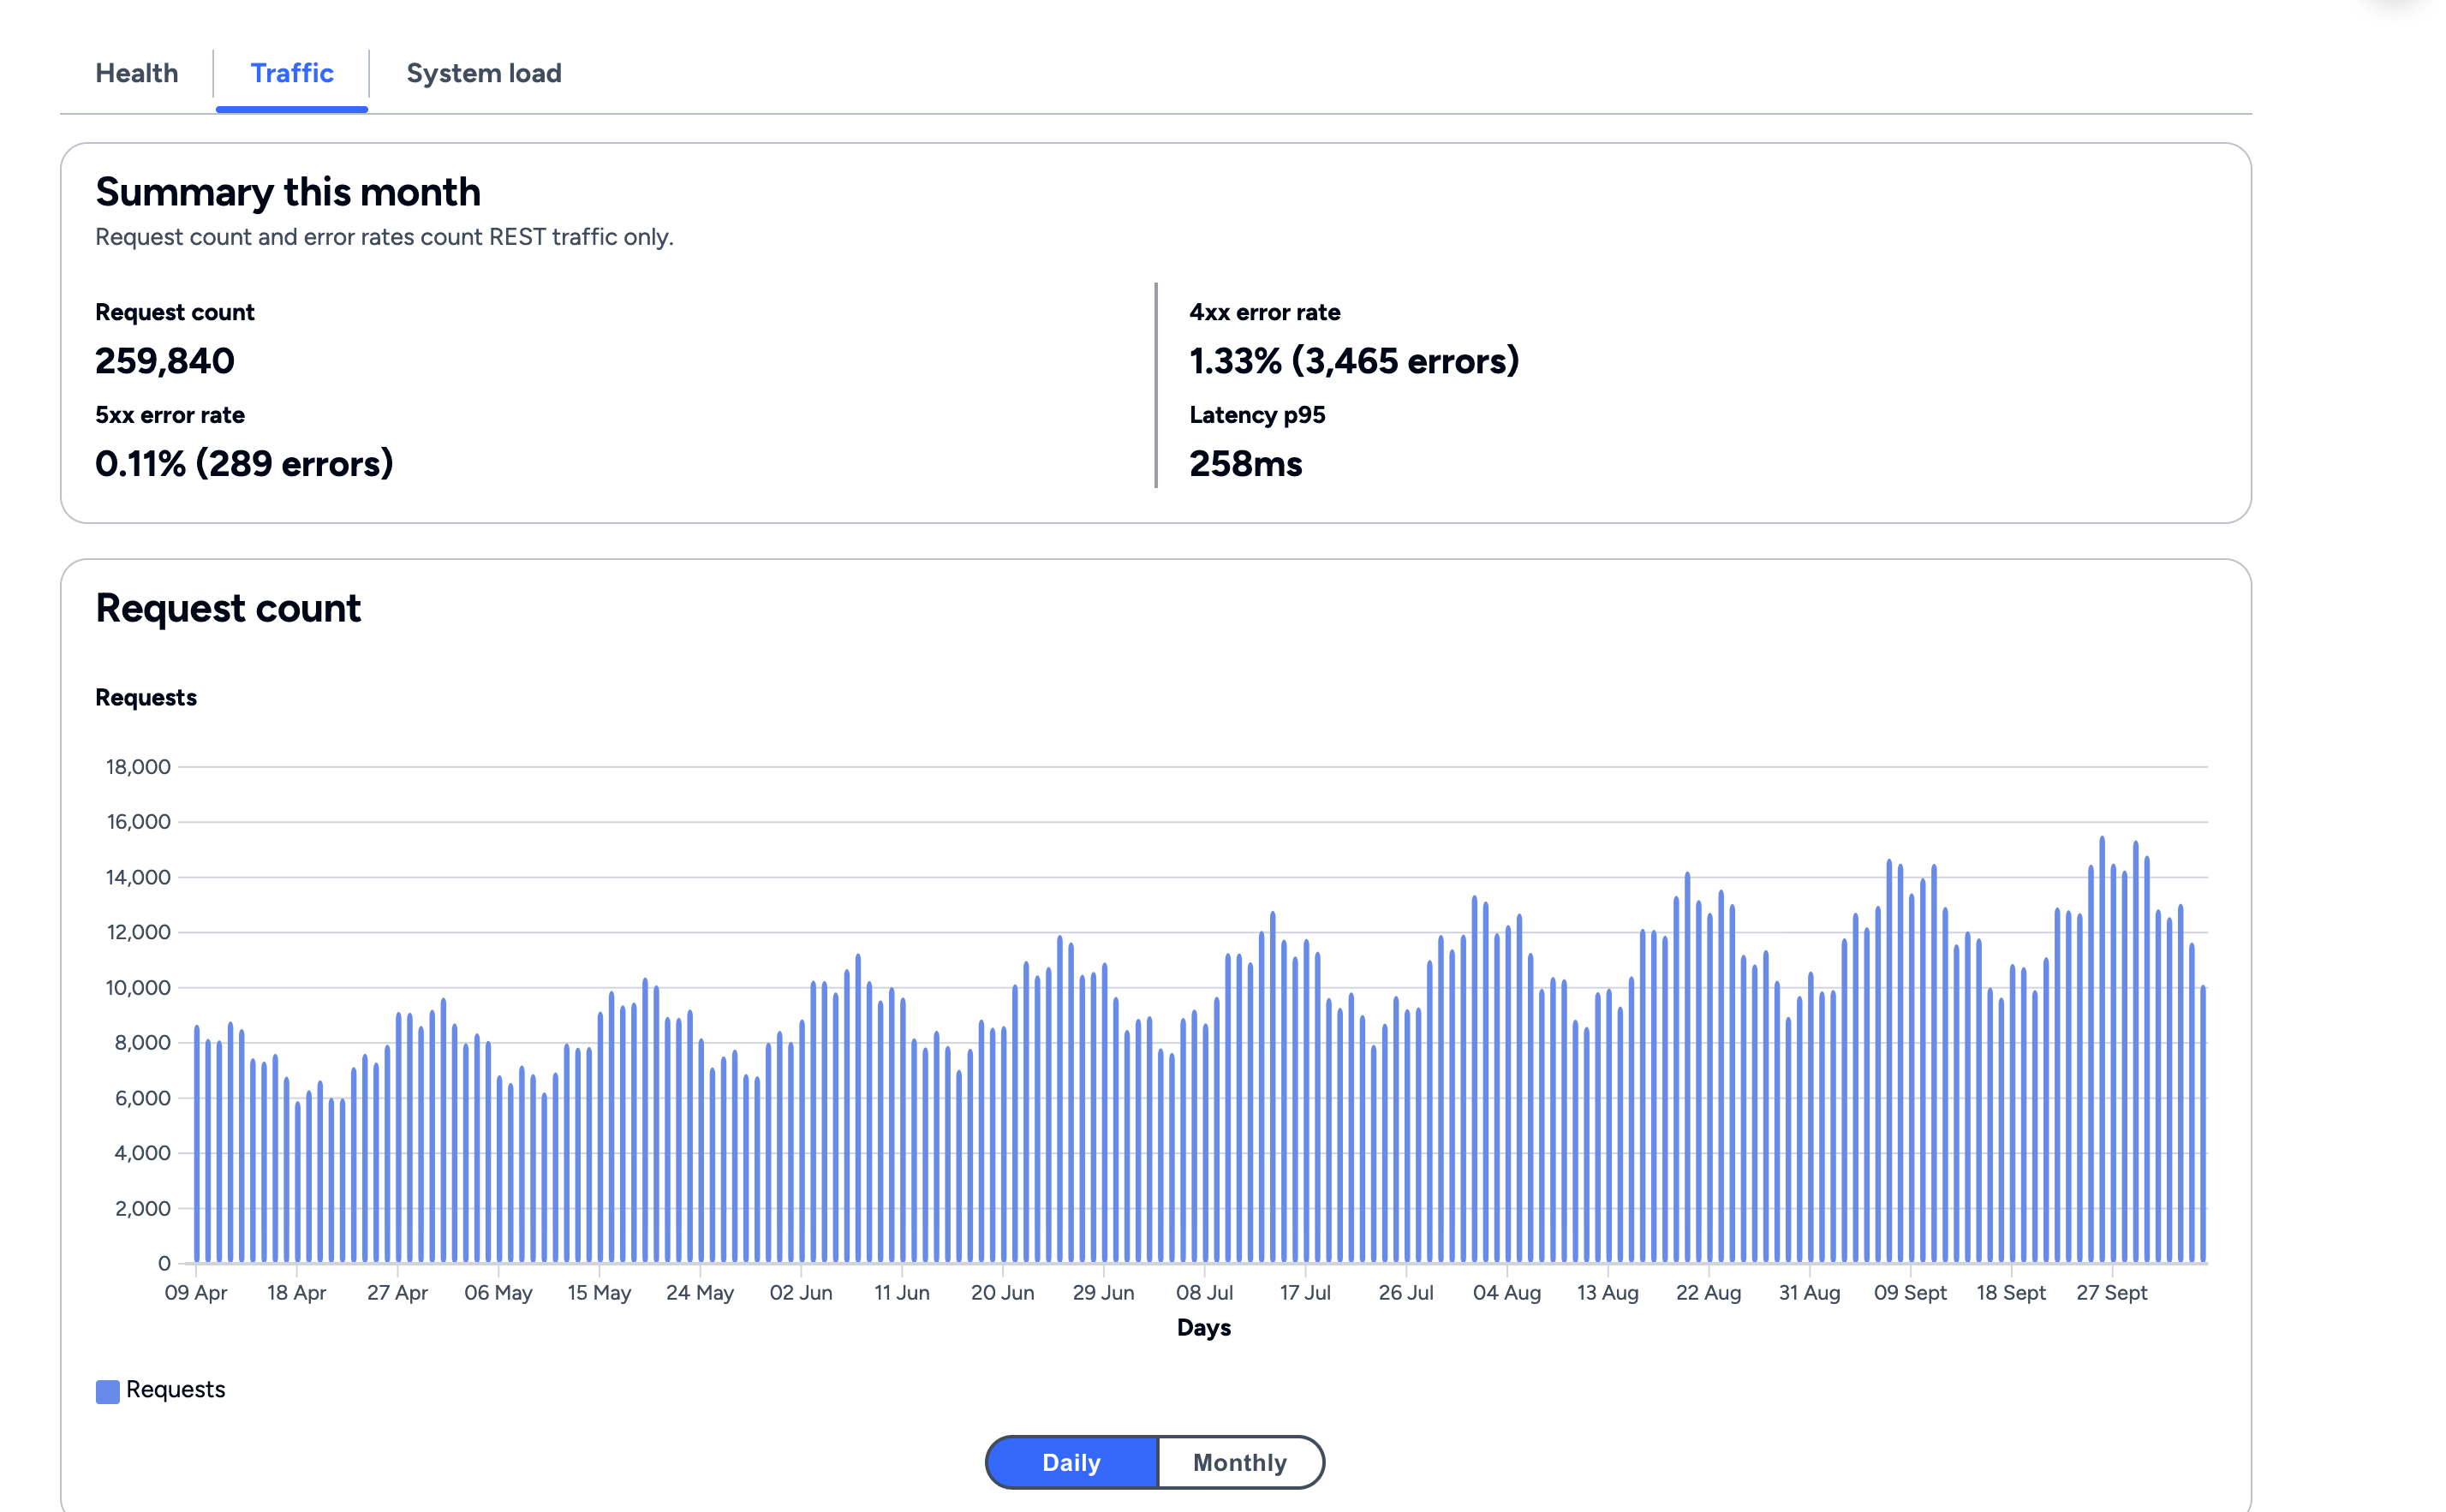
- Traffic: Request count, 5xx error rate, 4xx error rate, and Latency p95, with graphs for each. The Errors graph shows requests that returned a 4xx or 5xx response. Latency p95 is the time within which 95% of requests finished. All Traffic metrics cover REST traffic only.
- System load: Average CPU utilisation and Maximum CPU utilisation, with a CPU utilisation graph.
For running and monitoring a VTA, see Verifiable Trust Agent.
DIDComm Mediator
A DIDComm Mediator configuration’s page shows its metrics once the mediator is deployed. The metrics are grouped into three tabs:
- System utilisation: Average CPU utilisation, Maximum CPU utilisation, Average memory utilisation, and Maximum memory utilisation, with CPU utilisation and Memory utilisation graphs.
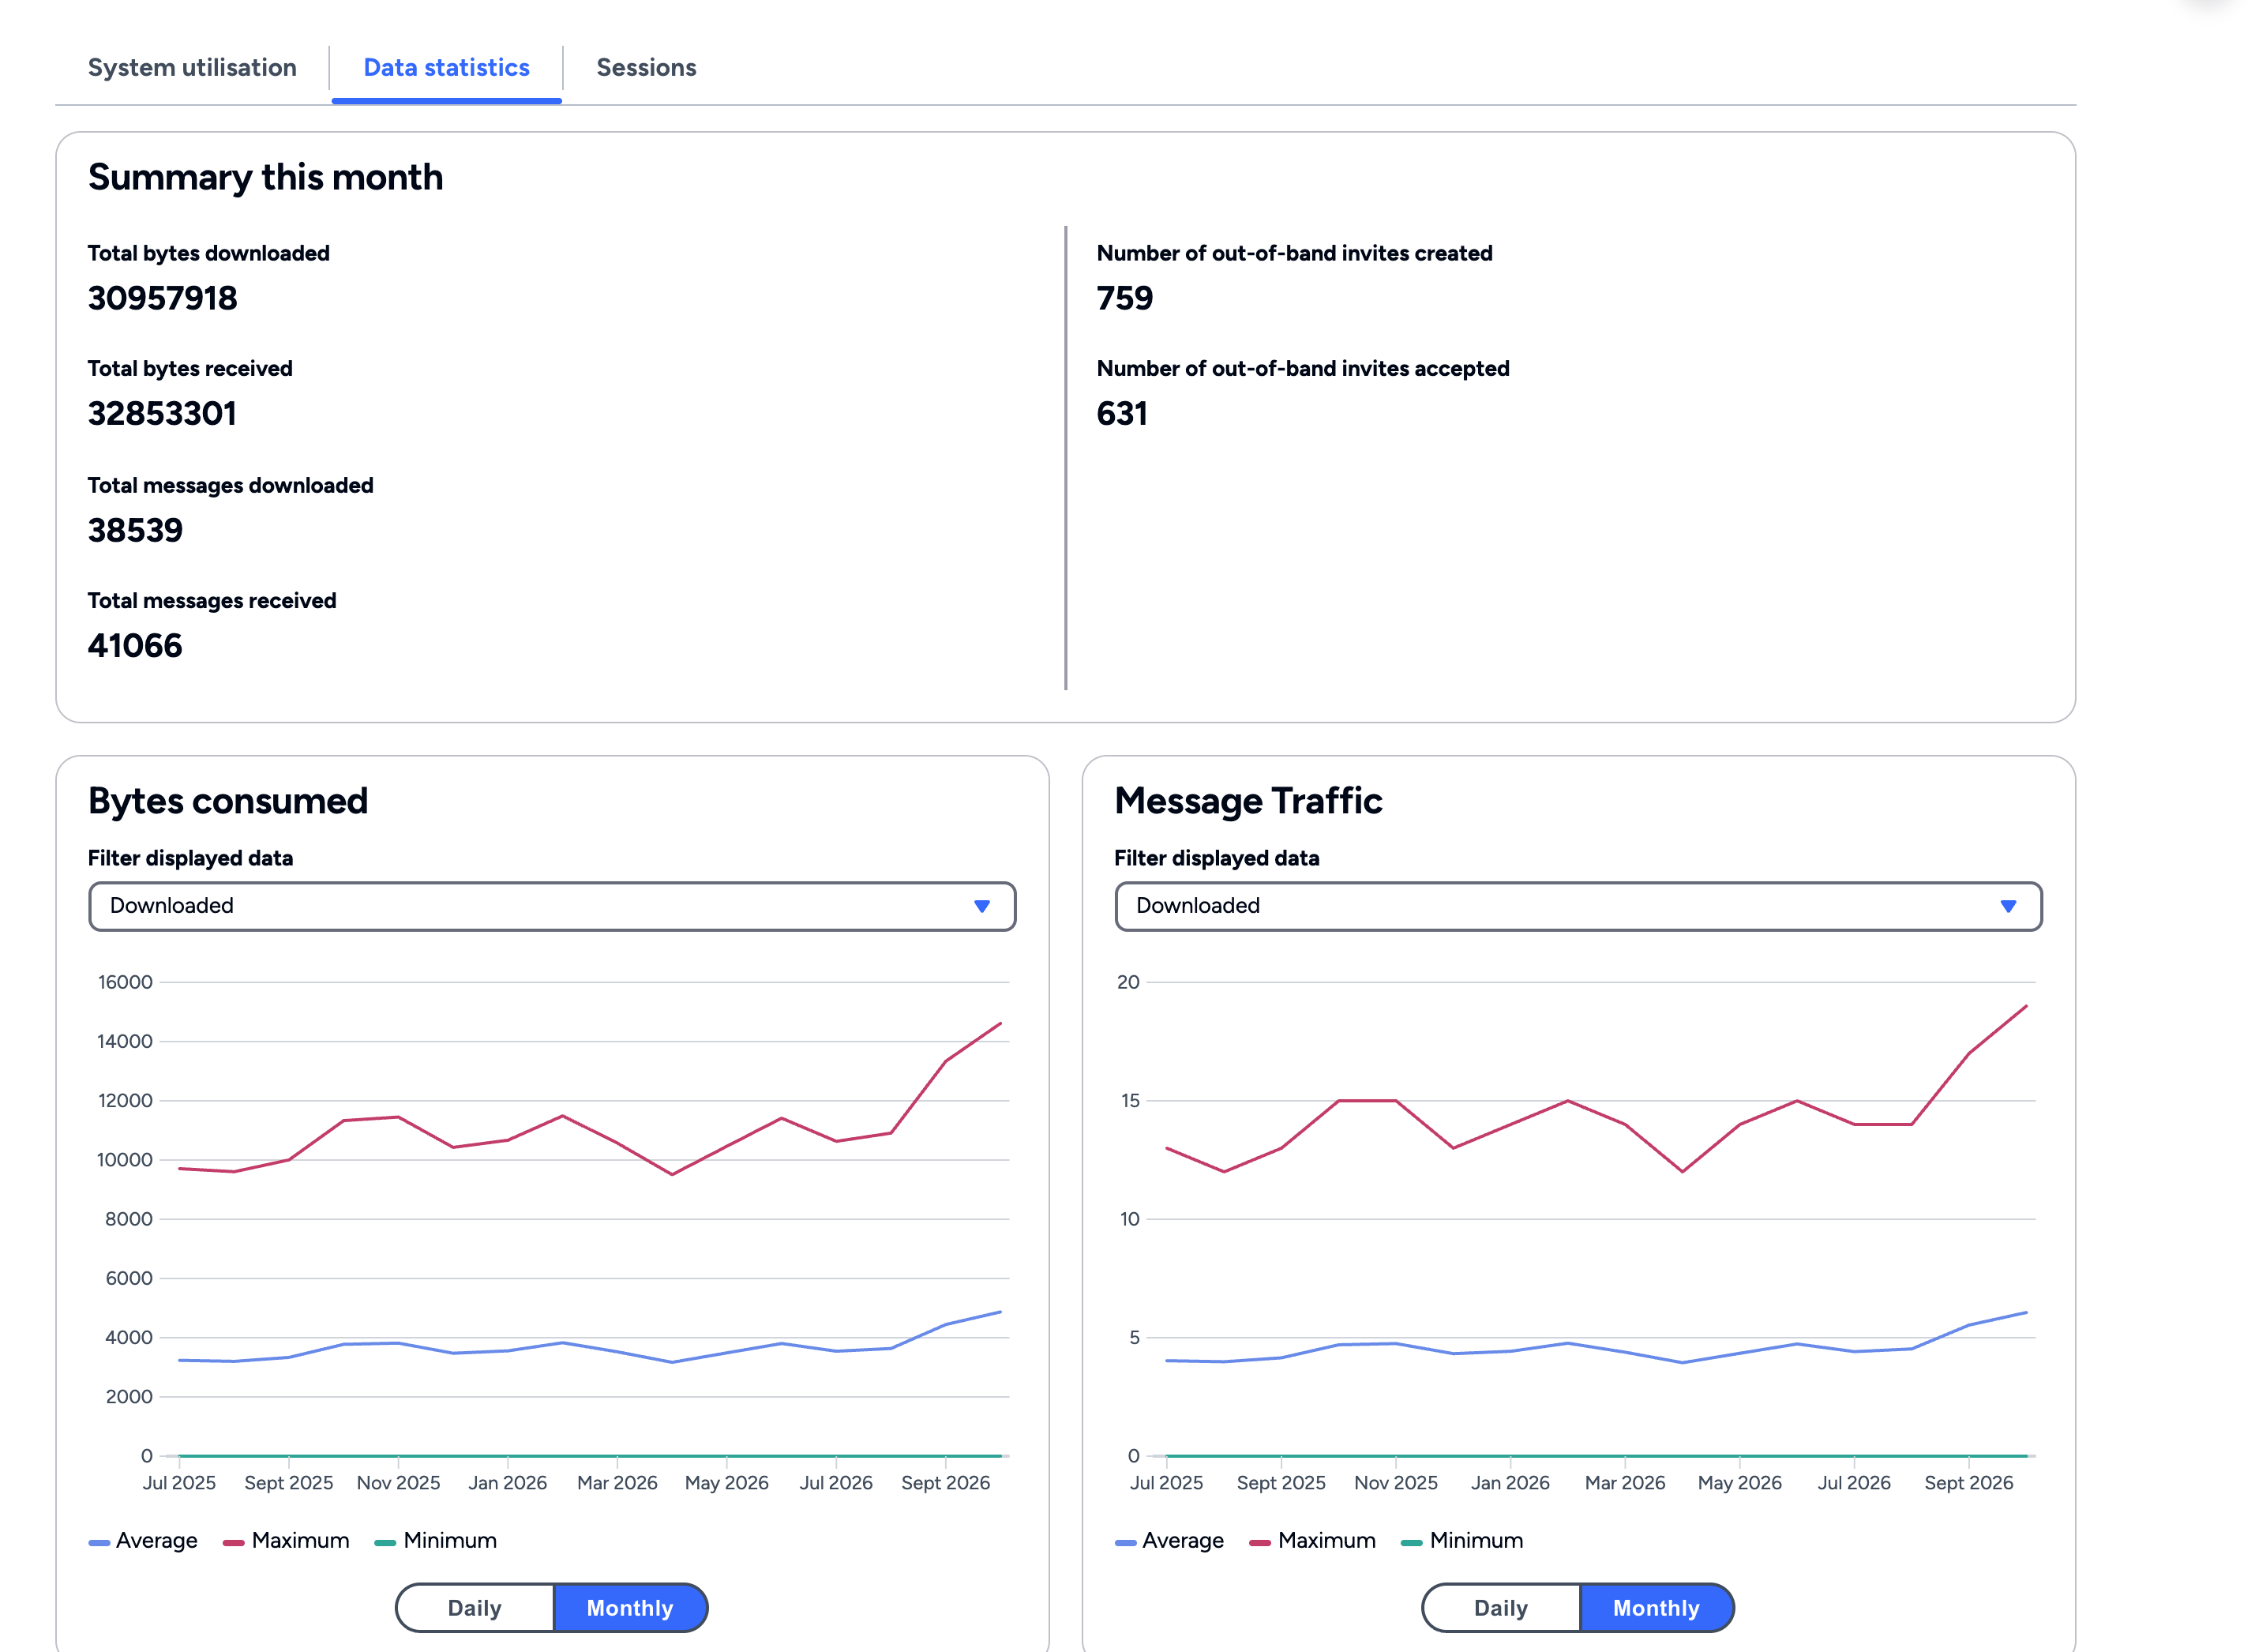
- Data statistics: the bytes and messages the mediator downloaded and received, and the out-of-band invites created and accepted. The Bytes consumed, Message Traffic, and Total out-of-band invites graphs show the same activity over time, and you can filter them by series, such as Downloaded, Received, or Deleted.
- Sessions: Total number of sessions initiated and Total number of sessions completed, with a Sessions graph.
For deploying and managing a mediator, see DIDComm Mediator.
Related
Glad to hear it! Please tell us how we can improve more.
Sorry to hear that. Please tell us how we can improve.
Thank you for sharing your feedback so we can improve your experience.